The Internet Economy’s Environmental Reckoning
By the end of 2025, the environmental footprint of the internet economy crosses a visible threshold. Digital systems no longer sit at the margins of ecological debate. They now appear in everyday conversations about electricity bills, water scarcity, housing approvals, mining, recycling, and decisions over where infrastructure is built. Artificial intelligence, cloud computing, ICT networks, IoT deployments, robotics, e-commerce logistics, digital health platforms, and connected or autonomous mobility shape how societies work, shop, move, heal, and communicate. Their environmental impact does not stem from poor design or inefficiency. It stems from scale. As connectivity becomes a basic condition of modern life, the physical systems that support it increasingly collide with environmental limits that are tangible and immediate.
Energy demand makes this shift most visible. The International Energy Agency estimates that data centres consume roughly 460 terawatt-hours of electricity globally, about 1.7 percent of total global electricity use. In practical terms, the digital backbone supporting internet-enabled activity already consumes as much power as a large industrial country. What matters environmentally is not only how much electricity is used, but where demand concentrates and how quickly it grows. Data centres and AI clusters tend to arrive in large increments and cluster geographically. In Northern Virginia, Ireland, the Netherlands, and parts of Scandinavia, grid operators report that data-centre requests now represent the largest share of new electricity demand. In these regions, environmental impact becomes a matter of allocation: how limited low-carbon power is divided between digital infrastructure, housing, transport electrification, and industry.

These pressures reflect everyday expectations as much as infrastructure planning. Connectivity expands because people expect it to. Same-day delivery, instant payments, real-time navigation, AI tools at work, streaming media, and constant communication are no longer treated as optional. They are embedded in daily routines across age groups and income levels in many countries. Global mobile data use continues to rise year after year, while e-commerce parcel volumes reach new highs. In the United States alone, annual parcel deliveries exceed 20 billion shipments, reflecting expectations of speed and convenience. At the same time, surveys show strong public concern about climate change and broad support for environmental protection. The tension lies in this gap: societies demand seamless digital services while expecting the infrastructure behind them to remain affordable, low-impact, and largely invisible.
Corporate reporting shows how this tension plays out in practice. Google reports extremely high efficiency in its data centres, with power-usage-effectiveness figures near 1.1, far better than industry norms a decade ago. Yet its 2024 environmental reporting also shows total greenhouse-gas emissions rising by more than 10 percent, driven largely by increased energy use and supply-chain emissions linked to AI hardware and cloud expansion. Similar patterns appear across other major operators. Efficiency reduces energy use per task, but improved performance and lower costs encourage more activity. In environmental terms, this reflects a rebound effect: gains per unit are real, yet total impact continues to grow.
Water use has become the most visible local concern because it affects communities directly. Large data centres can consume hundreds of thousands of cubic meters of water each year, depending on location and cooling design. In water-stressed parts of the United States and Europe, new facilities increasingly face opposition over freshwater use rather than emissions alone. Communities weigh employment and investment against long-term water security. Operators point to improved cooling efficiency and water-replenishment programs, but inconsistent reporting makes overall impact difficult to assess. As a result, environmental concern shifts from abstract debate to local decision-making, shaping where and how quickly digital infrastructure receives approval.
Material use anchors the internet economy firmly in the physical world. Devices, servers, sensors, batteries, and vehicles depend on lithium, cobalt, nickel, copper, and rare-earth elements, all of which carry environmental and social costs when mined and processed. The United Nations estimates that global electronic waste exceeds 60 million metric tonnes annually, with only about 22 percent properly collected and recycled. Rapid upgrade cycles, driven by performance requirements and software compatibility, add to this waste stream. Electric vehicles, robotics, and autonomous systems further increase demand for battery materials, shifting environmental pressure toward mining regions and recycling systems that remain uneven and fragmented. These outcomes reflect gaps in oversight and recovery capacity rather than failures of digital technology itself.
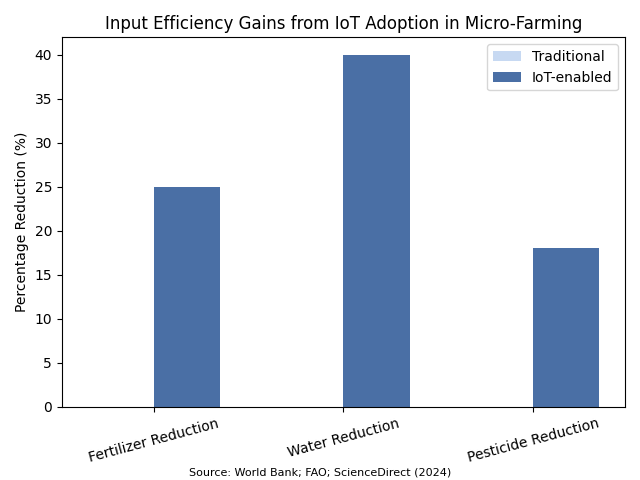
At the same time, internet-enabled systems can reduce environmental harm when they improve timing and coordination in physical systems. Precision agriculture using sensors and analytics shows 20 to 30 percent reductions in water use in documented cases. Satellite and IoT-based monitoring strengthens fisheries management and ecosystem protection by making activity easier to track. Smart-grid tools improve demand forecasting and support renewable-energy integration. Digital health services reduce travel and facility use in some care settings. In each case, environmental benefit emerges from better information applied to existing systems rather than from digital technology alone.
Core Environmental Pressure Points of the Internet Economy (2015–2025)
| Pressure Area | Primary Driver | Environmental Impact | Geographic Visibility |
|---|---|---|---|
| Electricity Demand | Data centres, AI workloads, cloud expansion | Rising grid load, fossil fuel reliance where clean power is constrained | North America, Europe, East Asia |
| Water Use | Cooling systems, facility scale | Freshwater withdrawal, competition with households and agriculture | U.S. Southwest, Southern Europe, Ireland |
| Material Extraction | Servers, devices, batteries | Mining-related land degradation and water contamination | Africa, Latin America, Asia-Pacific |
| Land Use | Large data-centre campuses | Loss of open land, heat and noise impacts | Urban and peri-urban regions |
Sources: International Energy Agency; Institute of Internet Economics; European Commission; U.S. Department of Energy
Taken together, the relationship between internet-enabled infrastructure and the environment at the end of 2025 remains unsettled. These systems can reduce waste and emissions while also increasing demand for electricity, water, minerals, and land. Outcomes depend less on individual technologies than on scale, incentives, and the capacity of institutions to manage trade-offs. This opening assessment establishes the context for examining where environmental gains appear, where they fall short, how impacts differ across regions, and which constraints are most likely to shape the internet’s environmental footprint in the years ahead.
Successes: Where Connectivity Reduces Environmental Waste
The environmental strengths associated with the internet appear most clearly where connectivity, data, and automation reduce everyday waste in systems people recognize: leaking water pipes, traffic congestion, unstable power grids, overfished seas, and fragmented health services. These gains do not arise from environmental intent. They emerge when digital infrastructure makes problems visible earlier and coordination easier, allowing existing systems to operate closer to their limits rather than beyond them.
Water systems offer one of the clearest illustrations. In many cities, 20 to 30 percent of treated drinking water is lost before it reaches a customer. That loss represents wasted energy, chemicals, and freshwater. Digital leak-detection tools shorten discovery times from months to days. In Queensland, Unitywater reports identifying more than 1,400 megaliters of potential water loss in a single year. In the United States, utilities using advanced sensors report savings of roughly 7 million gallons per day. These gains improve environmental outcomes while strengthening daily reliability, because water saved upstream translates directly into supply resilience downstream.
Agriculture follows a similar pattern. Farming accounts for roughly 70 percent of global freshwater withdrawals, and inefficient irrigation remains a major driver of water stress. Precision irrigation systems using sensors, connectivity, and weather data show 20 to 30 percent reductions in water use across many crops, often without reducing yields. Lower water use also means less energy for pumping and reduced runoff into rivers. In practice, these improvements support food production while limiting expansion of land and water use, linking environmental benefit directly to more stable livelihoods.
Electricity systems benefit in much the same way. Peak demand determines how much infrastructure must be built and how often high-emission power plants operate. Demand-response programs, enabled by smart meters and automated controls, reduce peak demand by up to 10 percent in well-integrated markets. Research cited by the World Economic Forum estimates that demand-side flexibility in the United States could free around 76 gigawatts of capacity, roughly 10 percent of peak demand. For consumers, this translates into fewer outages and lower long-term costs. For the environment, it reduces reliance on the most polluting generation sources.
Logistics provides one of the most visible examples of cumulative impact. With U.S. parcel volumes exceeding 22 billion shipments annually, small efficiency gains compound quickly. Improved routing and delivery consolidation reduce emissions per package by 10 to 20 percent in many cities. Platform design plays a critical role. Amazon reports that encouraging customers to choose a single weekly delivery day avoided more than 300 million delivery stops and over 100,000 metric tons of carbon emissions in under a year. Modest changes in how services are structured can reshape the movement of millions of vehicles.
Ocean monitoring highlights another strength rooted in visibility rather than restraint. Satellite imagery and AI-based vessel tracking improve detection of illegal fishing activity. Studies show that expanded satellite coverage increases the share of marine protected areas with no detected vessel activity from roughly 25 percent to more than 40 percent. These tools do not eliminate overfishing, but they make enforcement possible in regions where monitoring was previously impractical.
Healthcare illustrates a quieter but widely experienced effect. Telemedicine reduces millions of patient trips each year. National studies estimate avoided emissions equivalent to hundreds of millions of vehicle miles traveled, while hospital-level research shows substantially lower per-visit emissions when care moves online. For patients, this saves time and reduces travel burden. For the environment, it means fewer cars on the road and lower congestion.
Taken together, these examples show how the internet reduces environmental waste by improving visibility, timing, and coordination within physical systems. These gains do not remove environmental pressure, nor do they resolve the challenges created by scale, energy demand, and material use. They do, however, demonstrate that when digital systems operate alongside clear incentives and effective oversight, environmental improvement can coincide with better everyday living conditions.
Failures: Where Environmental Costs Accumulate Faster Than Gains
The environmental failures associated with the internet do not arise because digital systems are inefficient or poorly designed. They emerge because digital infrastructure often expands faster than the rules, planning systems, and public oversight meant to manage its physical footprint. For much of the internet’s growth, environmental impacts were poorly understood, weakly regulated, or treated as secondary concerns. Environmental protection itself has only recently become a broad societal priority, and its importance has shifted with political and economic cycles. During periods of rapid expansion, safeguards are frequently delayed or set aside to reduce costs and speed deployment. In other cases, environmental effects only become visible after infrastructure is already in place. Under these conditions, efficiency gains stop reducing total impact and instead enable growth that ecosystems and institutions struggle to absorb.
Digital Infrastructure Scale Indicators
| Indicator | Observed Trend | Relevance to Environmental Impact |
|---|---|---|
| Global data traffic | Consistent annual growth | Drives electricity demand and infrastructure expansion |
| AI compute intensity | Rapid acceleration since 2022 | Increases energy and hardware turnover |
| E-commerce parcel volumes | Record highs in major economies | Raises transport emissions and logistics intensity |
| Connected devices | Continued global growth | Expands material use and electronic waste |
Sources: OECD; International Telecommunication Union; Pitney Bowes; UN University
AI-driven data centres sit at the center of this imbalance. Once treated as background infrastructure, they now operate as energy-intensive industrial facilities. The International Energy Agency estimates that data centres consume roughly 460 terawatt-hours of electricity globally each year, and in several advanced economies they represent the fastest-growing source of new power demand. Environmentally, the issue is not average electricity use but how incremental demand is supplied. Where clean power is limited or grids are constrained, new load is often met by gas or coal generation. To users, AI services appear weightless and remote. To power systems, they arrive as permanent industrial demand with long-term emissions consequences.

Rising electricity demand also brings local pollution that is often disconnected from where digital services are consumed. Power plants supplying data-centre growth emit nitrogen oxides, particulate matter, and other pollutants that affect nearby communities. These effects are compounded by the widespread use of diesel backup generators, which are tested regularly and operated during outages. In some regions, individual data-centre campuses are permitted to operate dozens of large generators, creating localized air-quality risks that rarely appear in corporate emissions disclosures. Residents experience these impacts directly through noise, exhaust, and degraded air quality, even as digital services continue to be marketed as clean and immaterial.
Water stress creates another point of failure because it is immediate and difficult to offset. Large data centres can withdraw hundreds of thousands of cubic meters of freshwater each year, often from the same sources that supply households and agriculture. In parts of the U.S. Southwest and Southern Europe, communities report falling groundwater levels and intensifying competition for water following large-scale data-centre development. Beyond withdrawal volumes, contamination risks arise from cooling chemicals, construction runoff, and water-treatment processes. Because permits are typically reviewed project by project, cumulative impacts on shared watersheds often remain unmeasured until stress is already visible.
Land use and heat introduce quieter but persistent pressures. Data centres require large parcels of land near power and connectivity, often in urban or peri-urban areas. Once built, they are difficult to repurpose. Constant mechanical operation, waste heat, construction traffic, and supporting infrastructure alter local conditions in ways residents quickly notice. For nearby communities, environmental impact appears as lost open space, increased noise, heavier truck traffic, and higher local temperatures, even though the benefits of digital services accrue elsewhere.
Material use and waste further deepen the imbalance. The internet depends on rapid hardware turnover driven by AI workloads, security requirements, and performance demands. The United Nations University estimates that global electronic waste exceeds 60 million metric tonnes annually, with only around 22 percent properly collected and recycled. Much of the remainder is exported to lower-income regions, where informal recycling exposes workers and ecosystems to toxic substances. Upstream, the mining and processing of lithium, cobalt, nickel, and rare-earth elements contaminate water, degrade land, and displace communities. These costs remain largely invisible to end users and are poorly reflected in pricing or sustainability reporting.
Across these domains, a consistent pattern emerges. Environmental costs concentrate where infrastructure, extraction, and waste physically occur, while the benefits of digital services disperse across global user bases. Local communities absorb pollution, water stress, heat, and land-use change, while digital systems continue to scale with limited friction. Governance mechanisms struggle to keep pace with infrastructure that expands rapidly and spans jurisdictions. As a result, environmental pressure increasingly surfaces as local opposition, permitting delays, and political conflict rather than abstract concern. Understanding where and why these failures occur is essential for assessing how impacts vary by region and which constraints are most likely to shape the internet’s environmental footprint in the years ahead.
Regional Realities: Where Internet-Enabled Growth Meets Environmental Limits
The environmental footprint of the internet appears global when viewed through screens and dashboards, but it is experienced locally. Power grids carry the load, rivers supply cooling water, coastlines absorb discharge, and communities host infrastructure or manage its waste. Data centers, telecom networks, device manufacturing, battery supply chains, and logistics systems cluster where electricity is available, land can be permitted, and capital moves quickly. Environmental outcomes therefore depend less on the technology itself and more on energy mix, water stress, enforcement capacity, and whether political systems treat ecological harm as a binding constraint or a negotiable cost.
A second pattern cuts across borders. Regions that consume the most digital services often do not host the most damaging parts of the physical chain. Mining, refining, manufacturing, and informal recycling concentrate environmental harm in places with fewer monitoring resources or weaker bargaining power, while the benefits of connectivity remain widely distributed. This imbalance explains why “green digital growth” can look like progress in one country and degradation in another, sometimes for the same cloud platform, the same device, or the same AI workload.

United States: In the United States, environmental outcomes are shaped by scale and decentralization. Data-center growth is fast, investment-driven, and unevenly governed. Concentration in Northern Virginia has turned data centers into a planning issue rather than a purely technical one. Legislative reviews and utility filings raise concern about whether transmission and generation can scale fast enough. National reporting estimates that data centers accounted for about 4 percent of U.S. electricity consumption in 2024, with projections rising as AI workloads expand.
The strength of the U.S. system lies in advanced monitoring, efficiency gains, and large-scale renewable procurement by major operators. The hurdles are physical: grid congestion, land availability, and water use. Friction emerges locally, where communities experience diesel backup generator testing, air-quality impacts, and rising infrastructure costs directly, while the benefits of digital services remain diffuse and national in scope.
Europe: Europe treats environmental constraint as an operating condition rather than a secondary concern. Strong efficiency standards, water-use scrutiny, and land-use planning shape where and how digital infrastructure grows. The updated EU Energy Efficiency Directive increases reporting and governance pressure, while national politics can move faster than permitting timelines when grid security is at stake. Ireland illustrates this clearly. Public concern over a “data-center crisis” translated into policy, and by late 2025 the regulator’s Large Energy Users framework imposed stricter conditions on new connections, including expectations around dispatchable capacity and grid stability.
The success is tangible. Environmental and system costs are harder to ignore, and transparency has improved. The hurdle is capacity. High electricity prices and limited grid headroom slow expansion. Friction appears when constraint shifts the footprint outward, pushing manufacturing, marginal workloads, or waste processing into jurisdictions with looser oversight. Europe protects local rivers, air, and communities, but global environmental impact does not disappear. It moves.
China: China’s environmental outcomes reflect scale combined with regional variation. Digital infrastructure expands rapidly, guided by national planning but experienced locally. Analysts tracking data-center growth note tension between eastern demand centers and coal-heavy electricity supply. National policy increasingly attempts to steer compute capacity toward regions with cleaner power and cooler climates through the “East Data, West Compute” initiative, which academic analysis suggests could reduce emissions intensity under certain assumptions.
On the ground, outcomes diverge. In coal-dependent provinces, digital growth adds to air pollution days and water stress near industrial towns. Rivers near electronics manufacturing zones carry heavy pollutant loads, while mineral processing disrupts surrounding ecosystems. China’s strength lies in coordination and speed. Its hurdle is energy transition at scale. Friction emerges where national digital ambition concentrates environmental burden in specific regions that serve both domestic and global demand.
Asia (excluding China): Across South and Southeast Asia, environmental impact reflects rapid adoption meeting fragile infrastructure. In India, data centers’ share of electricity demand is projected to rise from about 0.8 percent in 2024 to roughly 2.6 percent by 2030, intensifying pressure on fossil-heavy grids and water systems already stressed by heat and urban growth. At the project level, operators increasingly emphasize renewable procurement and cooling efficiency, signaling real adaptation.
Singapore offers a different example. Its 2019–2022 data-center moratorium and subsequent selective approval regime forced competition on efficiency and sustainability. The strength is that environmental limits shape investment behavior. The hurdle is scale. Friction appears when constraint relocates impact rather than reducing it, especially in neighboring markets where grids remain carbon-intensive and enforcement uneven. For many communities, the environmental cost shows up as polluted rivers near manufacturing zones or unsafe conditions at informal e-waste sites.
Middle East: In the Middle East, digital growth confronts climate physics directly. Extreme heat and water scarcity turn cooling from an engineering detail into a central environmental constraint. Industry analysis shows that data-center expansion increases energy demand while raising urgent questions about freshwater access in regions where potable water is already scarce.
Desalination relieves inland water pressure but introduces new costs: high energy use and brine discharge that stresses marine ecosystems along shared coastlines. The region’s strength lies in capital availability, purpose-built infrastructure, and strong solar potential. The hurdle is reliability. Friction remains because near-term stability still depends on fossil generation, and water stress represents a hard ceiling that efficiency alone cannot remove.
Africa: In Africa, the internet’s environmental footprint is most visible at the beginning and end of the supply chain. The region supplies critical minerals and absorbs large volumes of electronic waste. Research on Ghana’s Agbogbloshie e-waste site documents severe contamination and health risks tied to informal dismantling and burning. Economic analysis links proximity to major e-waste sites in Ghana and Nigeria to higher infant and neonatal mortality.
At the extraction end, reporting on the Democratic Republic of the Congo describes acidified and polluted rivers near cobalt-mining regions, alongside weak accountability mechanisms. Digital connectivity also delivers real gains, including environmental monitoring and access to services. The friction lies in pricing. Global demand for devices and batteries often externalizes environmental harm, leaving local ecosystems and communities to bear the cost.
Latin America: Latin America shows how digital supply chains intersect with water scarcity and biodiversity. In Chile, lithium production in the Atacama region has become a reference case for water conflict. Satellite-based findings show parts of the salt flat sinking 1 to 2 centimeters per year in association with brine extraction.
At the same time, digital tools strengthen environmental governance. Brazil’s PRODES and DETER satellite systems support deforestation enforcement, and official reporting indicates forest loss declined alongside expanded monitoring. The strength lies in visibility and enforcement capacity. The hurdle is climate stress. Friction emerges as extraction, land conversion, drought, and fire continue to pressure ecosystems even when monitoring improves.
Oceans, Rivers, Air, and Animals: Some of the internet’s most significant environmental impacts occur in shared ecosystems with no single owner. Oceans host subsea cables and absorb stress from desalination brine and warming linked to energy use. Rivers carry runoff from mining, manufacturing, and informal recycling far downstream, affecting fisheries and drinking water. Air pollution from power generation and diesel backup systems crosses borders. Wildlife faces habitat loss, heat, and noise, even as satellites improve detection of illegal fishing and deforestation. Visibility has improved. Responsibility remains fragmented.

What the regional analysis reveals is profound.
Across regions, a consistent structure emerges. Environmental gains from connectivity are real but incremental. Environmental costs concentrate where infrastructure, extraction, and waste physically occur. Regulation and public pressure can deliver local wins, as Europe’s grid-connection rules and Brazil’s monitoring capacity show. Yet when constraints tighten in one place, the footprint often shifts rather than shrinks.
This uneven geography shapes what comes next. Over the near term, change is more likely to come from limits than breakthroughs: grid capacity, water availability, permitting friction, and public tolerance. These constraints, rather than technological optimism alone, will determine where and how the internet’s physical footprint grows in the years ahead.
Outlook: From Environmental Friction to Managed Constraint
The environmental future of the internet is increasingly shaped not by intention, but by its interaction with physical limits. Digital systems continue to expand, yet they now do so in closer contact with constraints tied to electricity supply, water availability, land use, and waste capacity. Globally, data centres already consume an estimated 1 to 1.5 percent of total electricity, and in several advanced economies they represent the single fastest-growing source of new grid demand. As a result, environmental considerations have shifted from peripheral concern to design condition, influencing where infrastructure is permitted, how it operates, and how quickly it can scale. This shift reflects practical reality rather than ideology, as environmental pressure is now locally visible and politically unavoidable.
In the near term, this transition is most evident where digital ambition meets planning reality. Grid-connection queues, water-use permits, zoning hearings, and waste-handling approvals increasingly determine the pace and location of digital growth. In Ireland, data centres already account for more than 20 percent of national electricity demand, prompting regulators to impose connection conditions linked to grid stability. In the United States, federal and regional grid operators report that data centres make up the majority of large new load requests in some markets, forcing planners to evaluate them alongside steel plants and chemical facilities. Where such rules are enforced, they reduce the risk that digital expansion displaces housing, transport electrification, or essential services. Where they are not, environmental pressure accumulates until it becomes politically disruptive.
Environmental Efficiency Gains Enabled by Connectivity
| Sector | Digital Intervention | Primary Environmental Benefit |
|---|---|---|
| Water utilities | Leak detection sensors and analytics | Reduced freshwater loss and treatment energy waste |
| Agriculture | Precision irrigation systems | Lower water withdrawals and energy use |
| Electricity grids | Demand-response platforms | Reduced peak emissions and grid stress |
| Logistics | Routing and delivery optimization | Lower fuel use per delivery |
Sources: FAO; World Bank; International Energy Agency; World Economic Forum
Efficiency improvements continue to deliver measurable gains within these constraints. Average data-centre power-usage effectiveness has improved from roughly 2.0 in the early 2010s to about 1.2 today, meaning far less electricity is wasted on cooling and overhead per unit of computation. Leading operators report even lower figures at hyperscale facilities. Water efficiency has also improved. Industry surveys show wider adoption of air-based cooling, reclaimed water, and basin-aware siting, reducing freshwater withdrawals compared with earlier designs. These advances reflect the successes outlined earlier, where monitoring and coordination reduce harm. At the same time, they reveal the limits highlighted in the failures section: total electricity and water demand continue to rise because scale consistently outpaces efficiency.
Material and waste systems show early but uneven adjustment. Global electronic waste generation exceeds 60 million metric tonnes per year, while formal collection and recycling rates remain near 22 percent, despite gradual improvement. Extended producer responsibility schemes now cover a growing share of electronics sold in Europe and parts of Asia, and procurement standards increasingly require traceability for critical minerals such as cobalt and lithium. These measures improve visibility and accountability across supply chains, yet informal recycling and environmentally damaging extraction persist where enforcement remains weak. The near-term outlook is therefore defined by containment rather than resolution. Environmental impact becomes harder to externalize quietly, but far from eliminated.
Over the longer term, the central question is whether digital growth aligns with ecological capacity. Efficiency alone cannot resolve this tension if demand for electricity, water, land, and materials continues to rise faster than sustainable supply. Long-term stability depends on whether growth is reshaped by limits rather than optimized around them. Grid expansion aligned with low-carbon generation could reduce emissions from incremental digital demand, particularly where fossil fuels still supply the marginal unit of electricity. Basin-level water governance could prevent further concentration of infrastructure in already stressed watersheds. Enforced cross-border waste and recycling rules could reduce the displacement of environmental harm to regions least equipped to manage it.
These shifts do not depend on speculative technology. They depend on governance capacity, institutional coordination, and political durability. Evidence from environmental monitoring shows that where institutions are strong, digital systems amplify protection by improving timing, coordination, and enforcement. Satellite data has already contributed to measurable reductions in illegal deforestation and improved fisheries oversight in several regions. Where institutions are weak, the same connectivity accelerates extraction, pollution, and waste. The internet is therefore neither inherently restorative nor inherently destructive. It magnifies the quality of decisions made around it.
Emerging Constraint Mechanisms Shaping Digital Growth
| Constraint Type | Policy or Market Signal | Observed Outcome |
|---|---|---|
| Grid capacity | Connection limits and queues | Slower infrastructure approvals |
| Water permits | Basin-level scrutiny | Site relocation or redesign |
| Land zoning | Community opposition | Permitting delays |
| Waste regulation | Extended producer responsibility | Improved traceability |
Sources: European Commission; U.S. Department of Energy; OECD; Institute of Internet Economics
Taken together, the outlook for the internet and environmental outcomes is constructive but conditional. The successes and failures outlined earlier are not contradictions, but results of the same systems operating under different constraints. Environmental considerations now sit at the operational core of internet economics because physical limits make avoidance impossible. Energy systems, water basins, land availability, and waste streams impose boundaries that no level of abstraction can bypass.
The future environmental footprint of the internet will be shaped less by innovation narratives than by choices about allocation. How societies balance connectivity, convenience, and ecological capacity will determine whether digital growth becomes more disciplined or continues to externalize costs across ecosystems and communities. That balance remains unresolved. What has changed is that it can no longer be deferred.
Key Takeaways
- The environmental impact of the internet is no longer abstract, as energy grids, water basins, land use, and waste systems now directly constrain where and how digital infrastructure can expand.
- Digital technologies deliver real environmental gains through efficiency, monitoring, and coordination, but these gains remain conditional on scale and enforcement rather than guaranteed outcomes.
- Environmental costs concentrate geographically, with extraction, manufacturing, and waste handling often occurring far from the regions that consume the most digital services.
- Improvements in efficiency and visibility reduce harm per unit of activity, yet total environmental pressure continues to rise where demand outpaces clean energy, water availability, and material recovery.
- Regulation and governance capacity determine outcomes more than technology itself, as the internet amplifies strong oversight and accelerates harm where enforcement is weak.
- Regional and ecological differences shape environmental outcomes, making digital growth manageable in some contexts and destabilizing in others.
- Environmentalism has shifted from a reputational concern to an operational constraint within internet economics, influencing planning, investment, and public acceptance.
- The future environmental footprint of the internet depends on whether growth aligns with physical limits or continues to externalize costs across ecosystems and communities.
Sources
The Internet’s Environmental Reckoning
- International Energy Agency (IEA); Data Centres and Data Transmission Networks; – Link
- International Energy Agency (IEA); Electricity 2024 – Analysis and Forecast to 2026; – Link
- European Commission; Energy Efficiency Directive (EU) 2023/1791; – Link
- Institute of Internet Economics (IoIE); Ecological Impact and Internet Economics; – Link
Where Connectivity Delivers Environmental Gains
- Uptime Institute; Global Data Center Survey 2023; – Link
- Lawrence Berkeley National Laboratory; United States Data Center Energy Usage Report; – Link
- Google; Environmental Report 2023; – Link
- Microsoft; Environmental Sustainability Report; – Link
Where Scale Outruns Environmental Capacity
- UN University; Global E-waste Monitor 2024; – Link
- OECD; Extended Producer Responsibility and E-Waste Management; – Link
- RAID & AFREWATCH; Cobalt Mining and Water Pollution in the Democratic Republic of the Congo; – Link
- National Institutes of Health (NIH); Health Impacts of Informal E-Waste Recycling in Ghana; – Link
Regional Realities: Where Internet-Enabled Growth Meets Environmental Limits
- Ireland Commission for Regulation of Utilities (CRU); Large Energy Users Connection Policy; – Link
- PJM Interconnection; Queue Reform and Large Load Integration; – Link
- Reuters; Data Centers, Energy Demand, and Grid Constraints; – Link
- Carbon Brief; China’s “East Data, West Compute” Project; – Link
- World Resources Institute (WRI); Aqueduct Water Risk Atlas; – Link
- UNEP-WCMC; Submarine Cables and Marine Biodiversity; – Link
- Brazil National Institute for Space Research (INPE); PRODES and DETER Deforestation Monitoring Systems; – Link
- Associated Press (AP); Amazon Deforestation Coverage; – Link
Outlook: From Environmental Friction to Managed Constraint
- U.S. Department of Energy; Electricity Grid Reliability and Load Growth; – Link
- International Energy Agency (IEA); Digitalisation and Energy; – Link
- Basel Convention Secretariat; Transboundary Movements of Hazardous Waste and E-Waste; – Link
- World Economic Forum; Resource Constraints and Digital Infrastructure; – Link
Global Fishing Watch; Satellite Monitoring and Fisheries Enforcement; – Link