Digital systems fail every day, and yet most of those failures pass without measurable consequence because users have gradually internalized a level of imperfection as the normal condition of online life. Surveys from PwC’s Digital Trust Insights report that more than 40 percent of consumers experience at least one digital service disruption each month, while separate industry monitoring of major cloud providers shows dozens of publicly reported service incidents annually across hyperscale platforms; and yet churn rates do not spike after each disruption, nor do users abandon entire ecosystems at the first sign of latency. Instead, what persists is a reflex—refresh, retry, reopen—that reflects behavioral adaptation rather than resignation.
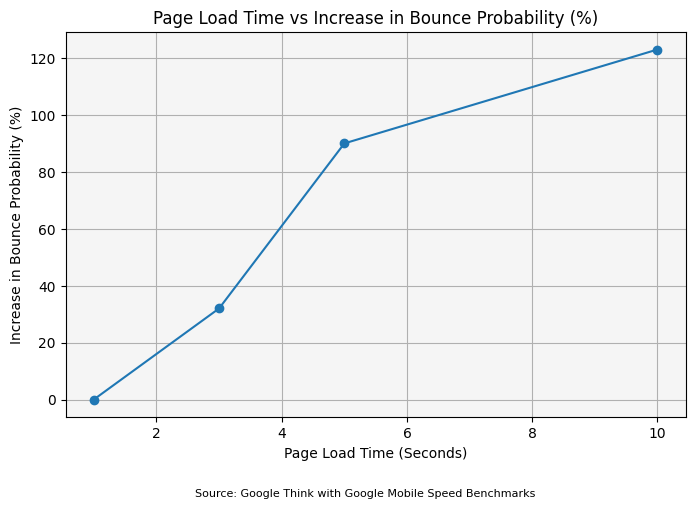
This adaptation is rational. A service advertising 99.9 percent uptime can still be unavailable for nearly nine hours each year, and even 99.99 percent availability permits almost an hour of annual downtime; yet users rarely translate those abstract figures into lived expectations. They experience reliability in seconds, not in annualized percentages. Research from Google’s web performance studies demonstrates that when page load time increases from one to three seconds, the probability of bounce rises by approximately 32 percent, and when load time reaches five seconds, abandonment risk increases dramatically, particularly on mobile devices. Yet millions of transactions survive those delays every day. The conclusion is not that users are indifferent, but that they are calibrated: they distinguish between friction and failure.
Over two decades of digital use, people have formed expectations that networks are complex and occasionally unstable. The internet trained us early—pages stalled, dial-up connections dropped, early apps crashed. That conditioning persists even as infrastructure has improved. Minor disruption sits inside what might be called a tolerance band, and as long as an incident remains inside that band, dissatisfaction does not automatically convert into economic loss.
The Friction Timeline: When Waiting Changes Meaning
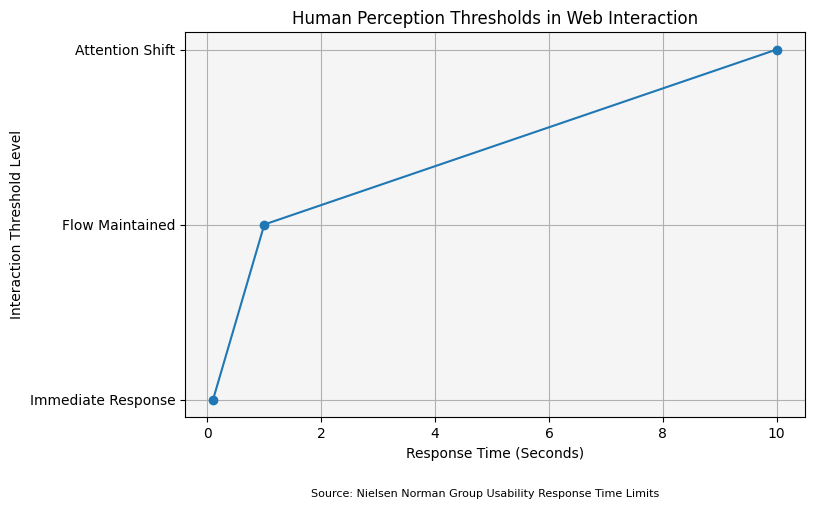
The decisive question is not whether systems fail, but how long they fail—and when waiting changes interpretation. Behavioral research and digital performance data together suggest that users move through identifiable stages of reaction as delay lengthens. The progression is less about precise seconds than about shifting perception, yet empirical patterns are consistent enough to map.
Below is a consolidated friction timeline derived from performance research, e-commerce analytics, and consumer behavior studies:
Behavioral Friction Timeline in Digital Transactions
| Duration of Delay | User Interpretation | Behavioral Response | Economic Impact Risk |
|---|---|---|---|
| 0–2 seconds | Normal processing | No interruption; continued interaction | Negligible |
| 2–5 seconds | Mild irritation | Increased bounce probability (32% rise from 1–3 sec; up to 90% by 5 sec in mobile contexts) | Moderate session abandonment risk |
| 5–15 seconds | Suspicion of slowness | Retry attempts; partial abandonment in transactional flows | Elevated conversion loss |
| 30–60 seconds | Perceived malfunction | Session termination; delayed return; cart abandonment (~70% average baseline) | Lost revenue per session |
| 5–30 minutes | Platform reliability questioned | Public complaints; reconsideration of provider (over 60% of digital banking users consider switching after repeated failures) | Reputational and churn risk |
| Multi-hour public outage | Systemic fragility | Trust reclassification; amplified media and regulatory scrutiny | Nonlinear revenue and brand damage |
Sources: Google Think with Google Mobile Speed Research; Baymard Institute Cart Abandonment Statistics; PwC Digital Trust Insights; Edelman Trust Barometer; Industry Digital Banking Surveys.
In the first two seconds, delay is interpreted as computation. Between two and five seconds, irritation increases but trust remains intact; Google’s findings suggest bounce probability rises significantly but does not universally translate into exit. Around ten seconds, suspicion begins to form. At thirty seconds, interpretation shifts qualitatively from “slow” to “broken.” Once delay extends into minutes—particularly in financial transactions or live events—users begin evaluating the system itself rather than the momentary interruption.
Consider a familiar scenario. A consumer attempts to purchase a pair of red shoes online. The checkout page hesitates for eight seconds. She frowns, refreshes, and completes the transaction. There is frustration, but no economic damage. The disruption remained within the tolerance band.
If checkout freezes for forty seconds, she may abandon the session. Yet industry data show that a substantial proportion of abandoned carts are later recovered; the interruption delayed revenue, but did not eliminate intent. The line into damage has not yet been crossed.
It is crossed when delay repeats, extends, or becomes visible.
From Nuisance to Instability
Behavioral economics offers insight into why this transition is nonlinear. Research pioneered by Daniel Kahneman and Amos Tversky demonstrates that losses are felt more acutely than gains; smooth performance over months becomes baseline expectation, while a visible failure carries disproportionate psychological weight. Reliability is not accumulated arithmetically. It is categorized emotionally.
A single short delay rarely changes perception. Repetition does. Surveys of digital banking users indicate that more than 60 percent would consider switching institutions after repeated access disruptions, not necessarily because of one prolonged outage but because pattern implies instability. In e-commerce, abandonment rates rise sharply once performance degradation becomes consistent rather than episodic. The interpretation shifts from inconvenience to structural weakness.
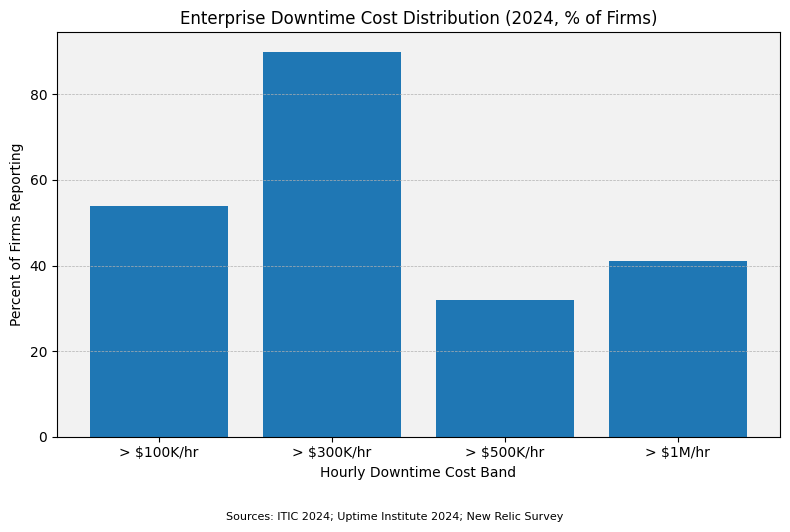
Visibility magnifies this effect. A two-minute outage affecting one individual can be blamed on connectivity. The same outage trending across social media becomes evidence of systemic fragility. Public narrative accelerates reclassification. Research on corporate IT failures shows that firms experiencing high-profile outages often see short-term stock volatility correlated with media intensity, not merely outage duration. The reputational signal is as consequential as the downtime itself.
What matters, then, is not only duration but meaning. Thirty seconds during casual browsing is irritating; thirty seconds during a securities trade is alarming. A two-minute delay at 3 a.m. is trivial; a two-minute delay during a nationally televised event becomes symbolic. Context compresses tolerance.
Damage begins when users move from assuming temporary congestion to suspecting unreliability.
The Human Determinants of Damage
It is tempting to treat reliability as an engineering metric, yet its economic consequences are fundamentally behavioral. Users do not audit server redundancy protocols; they ask themselves simpler questions: Does this usually work? Can I depend on it when it matters? Is this a pattern?
As long as disruption remains isolated and brief, the internal answers remain reassuring. The retry reflex dominates. Minor dissatisfaction dissipates as soon as the page loads. We press refresh and proceed.
But when delay exceeds expectation, when failure clusters, or when disruption becomes public narrative, the calculus changes. The mental category of the system shifts from dependable to unpredictable. At that moment, switching costs—which ordinarily deter migration—feel justified. The inconvenience of exploring alternatives becomes preferable to the anxiety of repetition.
The economic consequences are therefore nonlinear. Irritation may rise gradually with seconds; damage accelerates once interpretation changes. Most digital frustration does not translate into lost revenue because it remains inside the tolerance band. But once fragility is perceived, even high historical uptime cannot immediately repair confidence.
Users are accustomed to short-term dissatisfaction online. We expect occasional failure. We factor imperfection into digital life. That learned tolerance protects platforms from countless minor disruptions.
Yet there remains an invisible threshold—crossed when waiting turns into doubt, and doubt into narrative—at which patience dissolves.
Until that threshold is crossed, we refresh.
After it is crossed, we reconsider.
Key Takeaways
- Digital reliability is evaluated behaviorally rather than statistically; annual uptime percentages obscure the economic impact of concentrated disruption.
- Users are conditioned to tolerate short delays, with empirical evidence showing rising abandonment risk beyond 3–5 seconds, and qualitative interpretation shifting around 30 seconds.
- Economic damage is nonlinear; irritation does not equal churn, but repeated or prolonged failures can trigger rapid trust reclassification.
- Visibility amplifies disruption; publicly observed outages accelerate reputational risk beyond the technical duration of downtime.
- In transactional sectors such as banking and e-commerce, tolerance thresholds are narrower, with over 60 percent of digital banking users reporting willingness to switch after repeated access failures.
- Operational resilience must account for perception management, not only system uptime, as user confidence determines whether friction remains temporary or becomes economically material.
Sources
- Google; Find Out How You Stack Up to New Industry Benchmarks for Mobile Page Speed; – Link
- Google; Milliseconds Make Millions; – Link
- Nielsen Norman Group; Response Times The 3 Important Limits; – Link
- ITIC; 2024 Hourly Cost of Downtime Report; – Link
- Uptime Institute; Annual Outage Analysis 2024 Executive Summary; – Link
- Ponemon Institute; Cost of Data Center Outages; – Link
- PwC; Global Digital Trust Insights 2023; – Link
- IBM; Cost of a Data Breach Report 2023; – Link
- Baymard Institute; Cart Abandonment Rate Statistics; – Link
- Edelman; Edelman Trust Barometer 2023; – Link
- World Bank; World Development Report 2021 Digital for Development; – Link