
Blockchains may be the most transparent financial systems ever created. That does not make them easy to measure. The challenge is no longer finding the data, but deciding what the data actually mean.
The most familiar measure of cryptocurrency’s scale, market capitalization, describes valuation rather than production or capital formation. Multiplying circulating tokens by their current price assigns the marginal trading price to every outstanding unit. If 20 million tokens each trade at $100,000, their capitalization reaches $2 trillion. That figure establishes neither how much investors committed nor how much could be withdrawn at prevailing prices. It reveals still less about productive output, which need not increase when an asset appreciates.
Bitcoin’s realized capitalization provides another perspective by valuing unspent transaction outputs at their price when last moved rather than today’s price. The calculation approximates aggregate on-chain cost basis, although movements between wallets under common ownership can reset apparent valuations, while lost coins retain historical prices. Its usefulness lies in distinguishing changes in market expectations from the historical valuation of existing holdings, without treating that history as a direct measure of invested capital.
The economic distinction becomes particularly visible when prices and activity move in different directions. Cryptocurrency market capitalization contracted by approximately $2.1 trillion, nearly 50%, during the period examined in 2026 Chainalysis research, while estimated on-chain economic activity declined just 1.6%, from approximately $9.5 trillion to $9.4 trillion. Although the activity estimate depends on its methodology and is not equivalent to GDP, the divergence demonstrates that asset repricing need not produce a comparable contraction in financial activity conducted through blockchain networks.
A separate measure is needed for the actual production of economic services. Mining, validation, custody and transaction processing generate output and income independently of token prices. Updated international statistical standards classify unbacked cryptocurrencies such as Bitcoin as nonproduced nonfinancial assets, distinguishing them from associated services and financial instruments. This accounting separates changes in wealth from newly generated economic value and makes the distinction between a cryptocurrency market and a functioning digital economy more precise.
Cryptocurrency Market Value and Financial Activity
| Indicator | Comparison |
|---|---|
| Crypto service inflows | $9.30T to $8.90T |
| Total service inflows | −4.3% |
| Stablecoin service inflows | +5.3% |
Sources: Chainalysis
From Blockchain Transfers to Economic Transactions
Transaction volume is no more straightforward than market capitalization because recorded transfers do not necessarily involve independent economic parties. A company moving $10 million between wallets it controls produces $10 million of blockchain activity without transferring wealth to another entity. Returning those funds doubles the recorded movement. Bitcoin transactions can also contain change outputs that return unused funds to their sender. Adjusted transfer-value methodologies filter these technical artifacts to approximate economically meaningful movements rather than simply accumulate every recorded event.
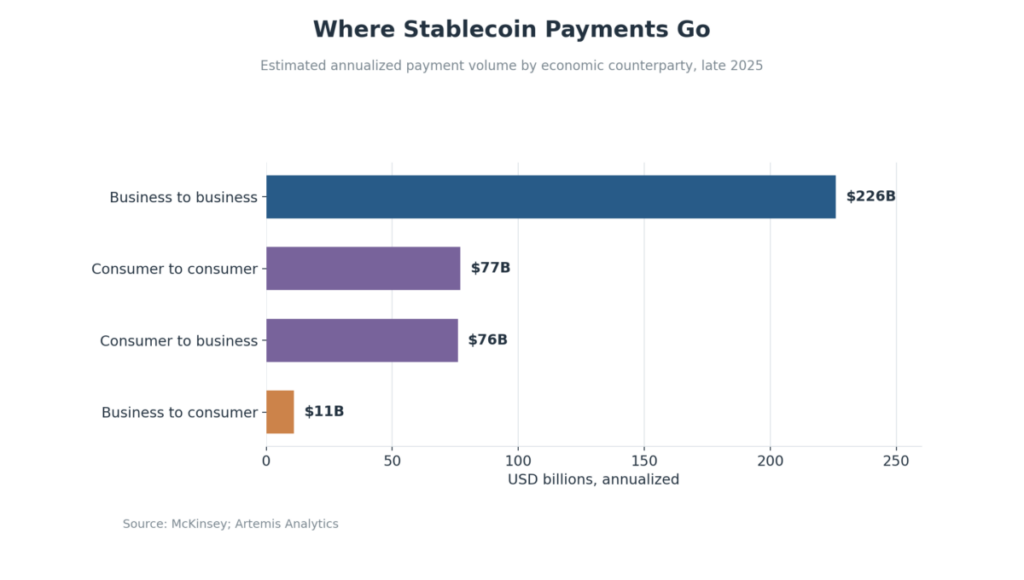
Stablecoins expose the difference at far greater scale. Reported transfers reached approximately $35 trillion during 2025, while identifiable payments were estimated at an annualized $390 billion based on December 2025 activity, equivalent to roughly 0.02% of global payment volumes. Much of the discrepancy reflects financial-market operations in which stablecoins facilitate collateral movements, trading or settlement rather than purchases in ordinary commerce. These activities remain economically meaningful, but their purpose differs from commercial payments. Indeed, business-to-business transfers accounted for approximately $226 billion of the estimated annualized payment total, demonstrating that genuine commercial use can be identified within much larger financial flows.
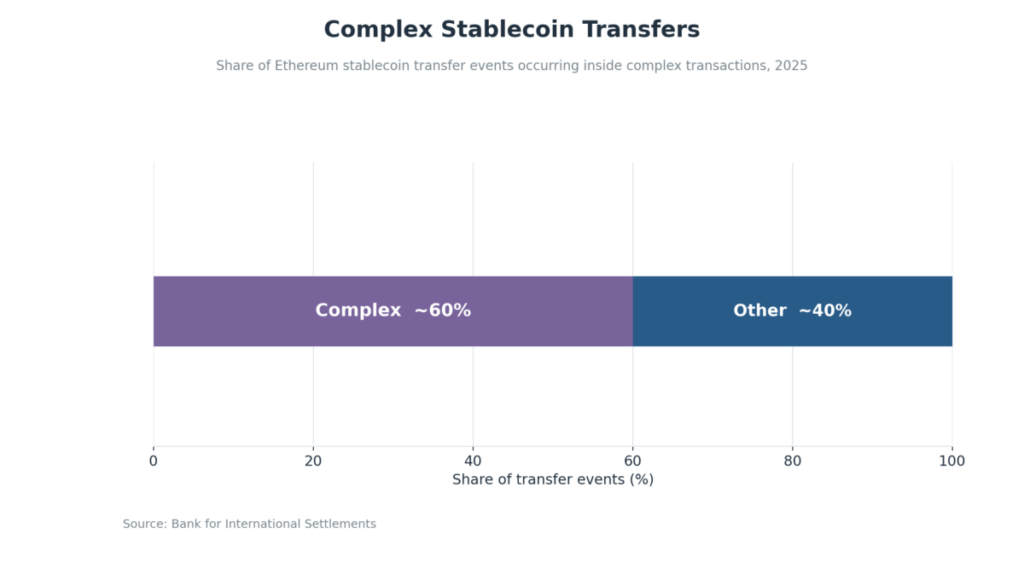
Programmable operations introduce another complication because a single financial transaction can generate numerous technically separate transfers. An examination of Ethereum activity published in June 2026 identified more than 593 million stablecoin transfer events embedded within approximately 141 million transactions. Nearly 60% of those events occurred inside complex transactions involving multiple movements. A lending or exchange operation can therefore produce several accurate ledger records without representing several independent economic exchanges.
The useful progression is from gross technical transfers to adjusted movements between independent entities, followed by classification of their economic purpose. Such accounting could distinguish commercial payments from financial settlement and internal transfers, allowing analysts to determine whether networks support expanding commerce, deeper financial intermediation or more frequent processing of existing activity.
Stablecoin Payments Across Economic Markets
| Payment Market | Stablecoin Share |
|---|---|
| Consumer to consumer | 0.37% |
| Consumer to business | 0.11% |
| Business to business | 0.01% |
| Business to consumer | 0.01% |
Sources: McKinsey, Artemis Analytics
Measuring Adoption and Monetary Activity
Identifying the participants behind transactions presents a related statistical problem, since wallet addresses do not correspond reliably to individual users. One person may control numerous addresses, while a custodial exchange represents millions of customers through relatively few wallets. Automated applications also generate activity without adding human participants. Active-address figures therefore describe network use more reliably than the number of people or businesses engaged in the economy.
Persistent participation offers stronger evidence of lasting adoption than the creation of new wallets during speculative cycles. Repeated activity among identifiable economic entities can reveal whether a network is developing a durable participant base. Geographic measurement is harder because addresses contain no inherent information about participants’ countries. National estimates consequently combine observable flows with assumptions about ownership and location, making their usefulness dependent on the quality of those inferences rather than direct knowledge of every participant.
Stablecoins provide a complementary monetary measure because their nominal values are designed to remain comparatively stable. When Bitcoin appreciates, existing holdings rise in dollar value without new coins entering circulation. Growth in dollar-backed stablecoin supply instead generally reflects additional token liabilities issued against funds or assets received by issuers. These claims expand monetary liquidity available within blockchain networks without necessarily creating additional dollars in the wider economy, making supply a more informative measure of digital monetary holdings than volatile asset valuations.
By early April 2026, global stablecoin capitalization was approximately $315 billion, with around 98% denominated in U.S. dollars. Their significance extends beyond commercial payments to access to dollar-denominated holdings and financial transfers, particularly where conventional banking is costly or difficult. Economic functions also vary by network. Ethereum stablecoin activity is more closely associated with programmable finance, whereas Tron holdings are more consistent with transactional and store-of-value motives. Even identical instruments can support different behavior depending on their financial environment.
Viewed together, outstanding supply, net issuance and adjusted circulation reveal different dimensions of monetary activity. Supply represents the stock of tokenized claims, while issuance shows expansion or contraction and circulation indicates how frequently liquidity changes hands between economic entities. Combined with persistent participation, these measures offer a more useful account of monetary adoption than transaction totals alone.
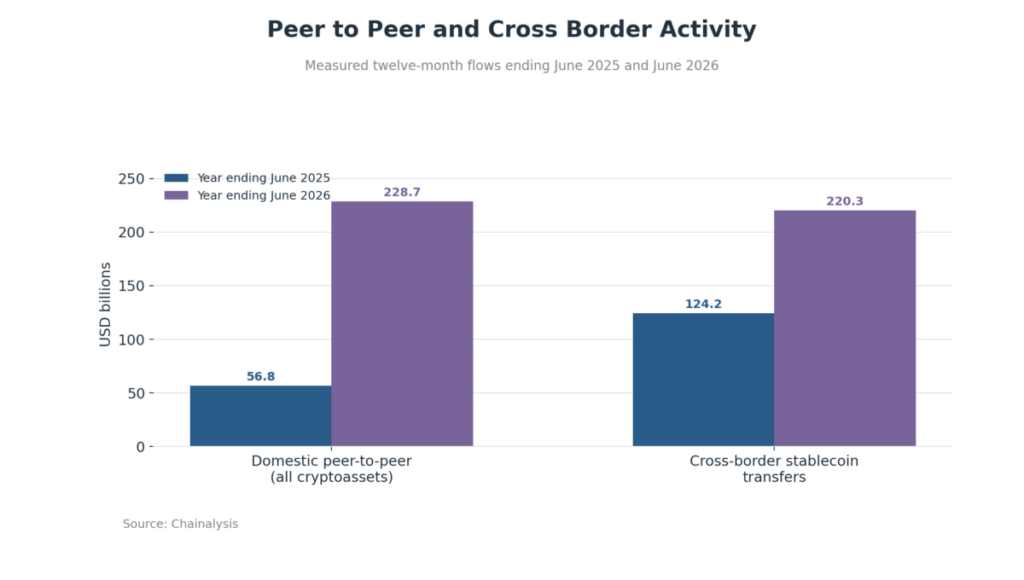
Growth in Direct Cryptocurrency Activity
| Activity | 2025 | 2026 |
|---|---|---|
| Domestic P2P transfers | $56.8B | $228.7B |
| Cross-border stablecoin flows | $124.2B | $220.3B |
Period: Twelve months ending June 30.
Finance, Capital and Infrastructure Demand
Decentralized finance introduced Total Value Locked, or TVL, as a measure of capital deposited into financial applications. Yet lending and collateral arrangements allow the same underlying assets to support multiple financial claims. At DeFi’s December 2021 peak, the estimated difference between TVL and Total Value Redeemable reached $139.87 billion, with gross TVL approximately twice the underlying redeemable value. The figures describe different dimensions of financial activity rather than competing versions of a single total.
Gross financial positions reveal intermediation and potential exposure, while redeemable value offers a clearer perspective on underlying capital. Conventional finance likewise distinguishes deposits from loans and collateralized claims, recognizing that successive transactions can create legitimate financial positions without bringing equivalent new savings into the system. Measuring DeFi requires the same separation between capital originally committed and claims subsequently constructed upon it.
Trading statistics introduce further complications because liquidity, derivatives activity and open interest can rise without broader commercial adoption. Even genuine trading volume should not be confused with production, while some reported volume may be artificial. Research examining 29 centralized exchanges found that wash trading averaged more than 70% of reported volume among the unregulated exchanges studied. The result does not describe the entire market, but demonstrates that the reliability of financial data matters before its economic significance can be assessed.
Infrastructure demand offers a different perspective through transaction fees, which represent expenditure for access to blockchain processing capacity. Persistent willingness to pay for settlement and computation can reveal demand independently of token valuations. Fees nevertheless rise during congestion or speculation and can decline as networks become more efficient, even when useful activity expands. Like telecommunications or computing capacity, blockchain processing must be judged through the services delivered, their cost and the demand they satisfy.
Together these indicators distinguish the financial economy operating through cryptocurrency from the value of its underlying services. Financial intermediation can provide economic benefits without representing direct production, while infrastructure demand may expand even when asset-market speculation recedes.
Blockchain Infrastructure Production and Revenue
| MARA Mining Operations | 2024 | 2025 |
|---|---|---|
| Bitcoin mining revenue | $599M | $872M |
| Bitcoin produced | 9,430 BTC | 8,799 BTC |
| Transaction fee share | 6.2% | 1.1% |
Sources: MARA Holdings
Toward On-Chain Economic Accounts
A comprehensive framework comparable to national economic accounts would address the deeper problem. Governments do not calculate GDP by adding every movement through the banking system, because financial transfers, consumption and productive investment represent different economic events. Applying that distinction to cryptocurrency would prevent enormous technical or financial flows from being mistaken for equally enormous output.
Under such a framework, asset valuations would remain separate from historical cost bases, while adjusted settlement measures would distinguish transactions between economic entities from internal movements. Stablecoin accounts would describe monetary liquidity, persistent participation would illuminate adoption, and capital measures would separate underlying resources from financial exposure. Infrastructure expenditure would retain its own significance. The objective is not to collapse these indicators into one number but to explain the economic functions they measure.
The foundations are already emerging as international statistical standards establish formal classifications for crypto assets and specialist analytics providers develop methods for reconstructing economic entities and identifying transaction purposes. No universally reconciled system of on-chain economic accounts has yet emerged, however, and significant activity remains outside the available records. Progress depends as much on transparent definitions and methodological consistency as on richer blockchain data.
Consider two descriptions of the same year. One reports that cryptocurrency market capitalization rose by 40%. The other explains that valuations increased while settlement activity remained stable, persistent participation expanded modestly and leveraged trading grew sharply. The first describes an asset market. The second begins to explain the economy operating within it.
The ultimate objective need not be a single cryptocurrency GDP figure, but a coherent set of accounts that can distinguish accumulated assets from monetary flows and financial activity from productive services. Better measurement would reveal whether crypto’s development reflects speculative appreciation, growing financial complexity or wider adoption of useful digital infrastructure. It would also illuminate where value is created, who participates and how these systems interact with the conventional economy.
Crypto does not suffer from a shortage of data. It suffers from a shortage of economic accounting sophisticated enough to interpret the data it already has.
Economic Classification of Cryptocurrency Activity
| Economic Item | Statistical Treatment | Accounting Category |
|---|---|---|
| Unbacked cryptocurrency | Nonproduced asset | Nonfinancial assets |
| Tokens with issuer liabilities | Financial claim | Financial assets |
| Mining and validation | Service output | Production account |
| Exchange commissions | Intermediation services | Services account |
Sources: International Monetary Fund
TL;DR Summary
-
Blockchain transparency does not automatically reveal the economic meaning of recorded activity.
-
Cryptocurrency market capitalization measures valuation rather than economic production or invested capital.
-
Public ledgers can exaggerate economic activity through technical duplication while missing transactions conducted off-chain.
-
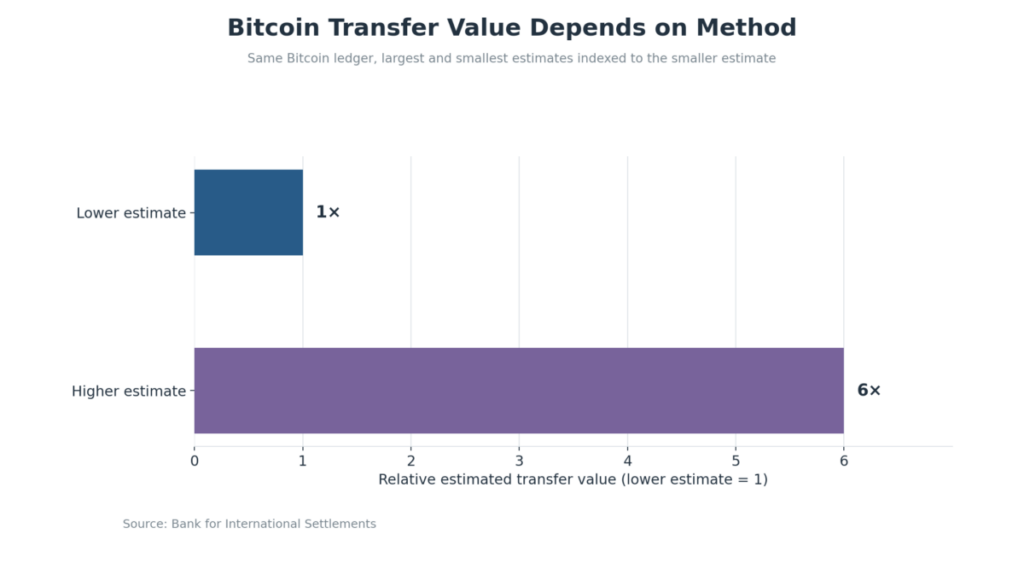
Bitcoin transaction-value estimates can vary sixfold depending on the measurement methodology.
-
Stablecoin transfer volumes substantially exceed identifiable commercial-payment activity.
-
Complex programmable transactions can generate multiple transfer records from a single economic operation.
-
Wallet addresses cannot reliably measure individual users or persistent cryptocurrency adoption.
-
Stablecoin supply, issuance and circulation provide monetary indicators distinct from payment volume.
-
DeFi’s TVL can substantially exceed underlying redeemable capital as financial claims are reused.
-
Financial turnover measures market activity without independently establishing commercial adoption.
-
Transaction fees reveal infrastructure demand, although congestion and efficiency affect their interpretation.
-
Classified economic accounts would distinguish asset valuation, monetary activity, financial intermediation and production.
Sources
-
Bank for International Settlements; Hidden by Complexity? Measuring Stablecoin, Crypto and Decentralised Finance Ecosystems; – Link
-
International Monetary Fund; Compilation Guidance on Crypto Assets; – Link
Market Value Is Not Economic Size
-
Glassnode; The Foundational On-chain Metric: The Realized Cap; – Link
-
Chainalysis; 2026 Global Crypto Adoption Index; – Link
From Blockchain Transfers to Economic Transactions
-
Bank for International Settlements; The Anatomy of Stablecoin Transactions; – Link
-
McKinsey & Company and Artemis Analytics; Stablecoins in Payments: What the Raw Transaction Numbers Miss; – Link
-
Coin Metrics; Transfer Value Methodology; – Link
Measuring Adoption and Monetary Activity
-
Bank for International Settlements; Stablecoins: Framing the Debate; – Link
-
Chainalysis; 2025 Global Crypto Adoption Index; – Link
Finance, Capital and Infrastructure Demand
-
Luo et al.; Piercing the Veil of TVL: DeFi Reappraised; – Link
-
DefiLlama; Methodology for Calculating Chain TVL; – Link
-
Cong et al.; Crypto Wash Trading; – Link
-
MARA Holdings; Annual Report 2025, Form 10-K; – Link
Toward On-Chain Economic Accounts
-
International Monetary Fund; New Standards for Economic Data Aim to Sharpen View of Global Economy; – Link
- International Monetary Fund; IMF Committee on Balance of Payments Statistics, Forty-Fifth Meeting; – Link
Keywords: Internet Economics, Cryptocurrency, Economic Measurement, Blockchain Analytics, Monetary Liquidity, Digital Asset Accounting, Financial Intermediation