
A network can reach a community while leaving much of its economic value unrealized. In 2026, an estimated 97% of the world’s population lived within reach of at least a 3G network, while 76% used the internet. First access still matters, often through mobile service. Where a network is already in place, better service may let local businesses trade more reliably. Replacing aging equipment can keep households connected as the system they depend on becomes harder to maintain. The economic return depends on what people can do with the improvement. Its environmental cost depends on the work and resources needed to deliver it over the life of the network.
Australia’s A$750 million fixed wireless and satellite upgrade, including A$480 million from the government, gave more than 120,000 homes and businesses in the national satellite footprint the option of fixed wireless. The operator reported that giving customers a path to switch freed satellite capacity and helped it introduce uncapped plans for customers who remained. That benefit reached households outside the range of the terrestrial network. A full appraisal would weigh it alongside the equipment and electricity needed to serve the customers who moved to fixed wireless.
| Population group | Urban residents online | Rural residents online |
|---|---|---|
| World, 2026 | 82% | 63% |
| Low-income countries, 2026 | 41% | 17% |
Sources: International Telecommunication Union
What Households Receive After the Work Is Done
During weekday evening peaks in March 2026, downloads on 153 monitored Australian fixed wireless connections averaged 83.8% of the maximum wholesale plan speed, down from 89.7% across all hours. Uploads fell from 70.1% across all hours to 63.7% during those peaks. A home business sending files may feel that shortfall when its customers are most active. The measurements describe performance across sampled plans. Establishing what the upgrade delivered to former satellite customers would require following the households that switched.
Australia’s copper replacement program confronted a different obstacle. Until July 2026, most eligible customers upgrading from fiber to the curb had to order a plan that met a minimum speed tier to qualify for full fiber. Removing that requirement let households replace the final copper segment while choosing a plan suited to their needs. More than 1.3 million customers had already moved from copper-based connections to full fiber under the national programs by then. The rule change opened the upgrade to households that wanted to replace the old line and had little reason to pay for more speed.
An operator can limit work around the home by using infrastructure already in place. An available duct can carry fiber with less excavation, while a tower with adequate power and onward capacity can serve more premises without a new route to each one. A satellite terminal may also require little work at the property because much of the infrastructure sits elsewhere. The ground network still draws electricity. The spacecraft have to be manufactured, launched, and eventually replaced.
The footprint of Australia’s upgrade would have to be established from the project’s own records. Site and construction records would show what was reused and what had to be built. Equipment and electricity records would show how the shift in customers changed the resources required to operate both networks.
| Reliability measure, March 2026 | NBN fixed wireless | NBN Sky Muster satellite |
|---|---|---|
| Average outages per day | 0.12 | 0.66 |
| Outages lasting 3 minutes or less | 63% | 64% |
Sources: Australian Competition and Consumer Commission
Where the Network Falls Short of the Economy
Indonesia completed the 12,200-kilometer Palapa Ring in 2019, connecting 57 cities and remote districts in central and eastern Indonesia to the broader backbone. A 2025 assessment found that the network remained underused, in part because links to end users and direct connections to wholesale internet gateways were limited. National capacity had come closer to those districts. Local providers still needed to buy it on workable terms and carry it the rest of the way to customers.
In London, the constraint can sit within a few streets. Measurements across 19 areas found that signal strength alone could no longer explain differences in download speeds. Along Queen Victoria Street, operators gained access to shared small radio units that could add capacity close to users. The Indonesian case shows what happens when capacity stops short of local customers. In London’s financial district, the question was how to add it where demand already concentrated. Finding the bottleneck helps determine where work is necessary and how much disruption people may have to live through.
For a producer, dependable broadband can make it easier to confirm an order and receive payment in time to arrange freight. A study of rural Italian municipalities used the staggered timing of a broadband upgrade to compare changes among firms in places that received it at different times. Over two years, availability was associated with 14.8% higher firm revenue and 9.1% higher total factor productivity. The study found no statistically significant change in local employment.
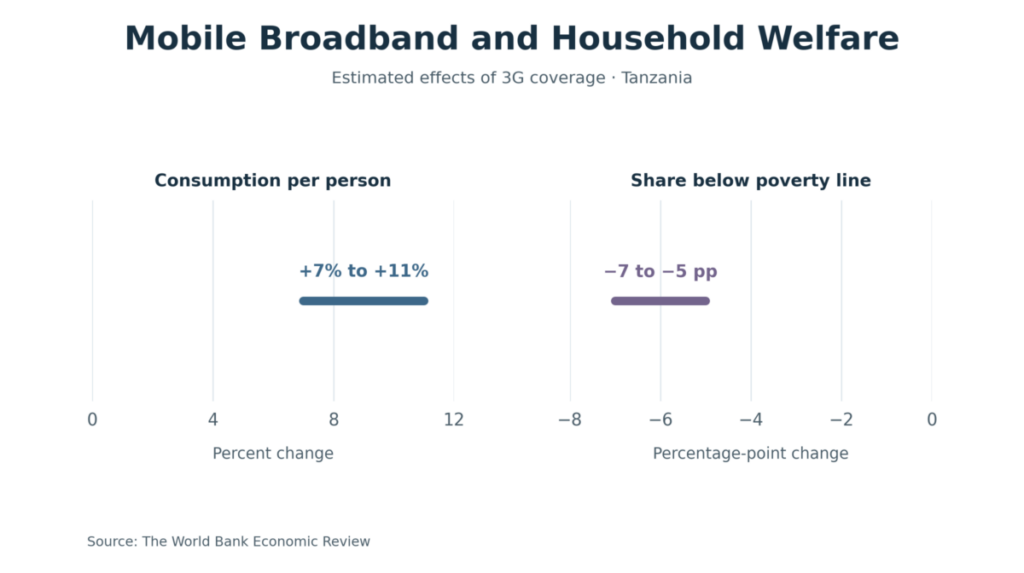
In Tanzania, researchers matched household survey locations to maps of the staggered 3G rollout and compared changes according to when coverage arrived. They estimated a 7% to 11% increase in consumption per person and a decline of 5 to 7 percentage points in the share of households below the national poverty line. Those estimates describe exposure to coverage. Whether individual households subscribed was outside the comparison. Costa Rica’s subsidy for fixed broadband and a device for eligible households addresses that next step directly by reducing the cost of using available service.
| Administrative level in Indonesia | Share with fiber distribution points, December 2024 |
|---|---|
| Cities and districts | 98% |
| Subdistricts | 70% |
| Villages | About 50% |
Sources: World Bank
The Costs a Construction Bid Leaves Out
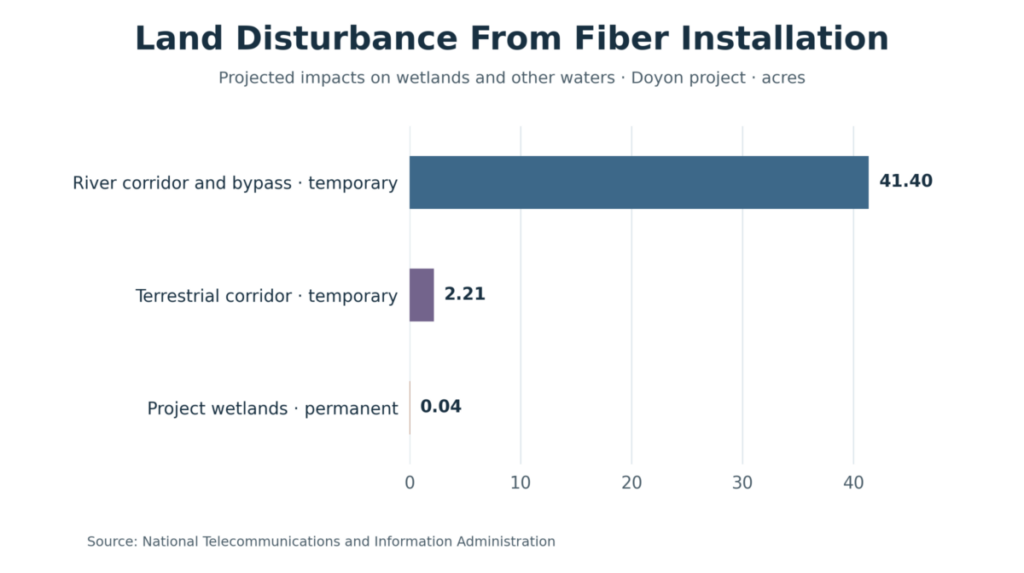
The environmental assessment for the proposed Doyon fiber project in Alaska estimated temporary disturbance to 43.61 acres of wetlands and other waters, including work in the Yukon River. It projected 0.04 acres of permanent wetland impact where access structures would remain. A route appraisal has to account for both the ground exposed to construction and the smaller area that will stay occupied. On a commercial street, a pavement closure affects deliveries while work is underway. Equipment left above ground becomes part of the street for years.
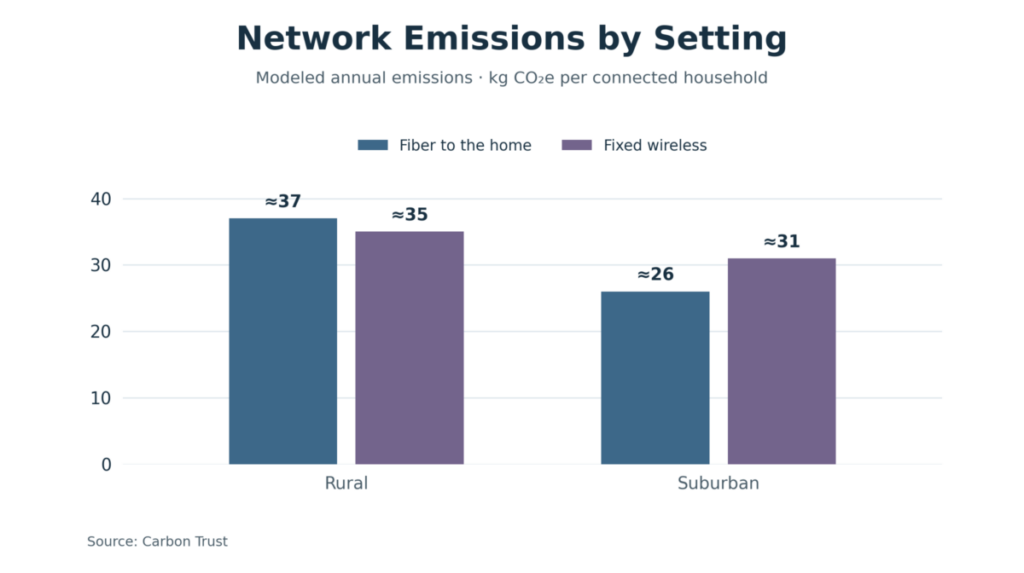
A 2025 lifecycle model put rural emissions from the access network and customer equipment at roughly 37 kg CO₂e per connected household per year for fiber to the home and 35 kg for fixed wireless. In the suburban scenarios, the order reversed. Fiber was estimated at roughly 26 kg per household per year and wireless at 31 kg. The model excluded the shared backbone and core network. Longer cable routes can increase the materials and civil works needed for fiber. The source of electricity can change the footprint of keeping equipment in service.
The European Union’s Gigabit Infrastructure Act provides for access to existing physical infrastructure and coordination of civil works. A usable duct can spare a neighborhood new excavation. Where a street must be opened, combining cable installation with planned repairs can spare businesses a second interruption to deliveries. These options matter most before a route and budget are settled, while providers still have a choice about how to reach customers.
Keeping the network in service is a separate obligation. A U.S. review found that operating and maintenance costs are often higher in remote areas served by broadband programs. A provider may have to spread years of repair and replacement costs across relatively few subscriptions. Public support can make sense where the connection also helps firms reach customers or households reach essential services. The funding decision depends on whether those gains justify the continuing cost of keeping service affordable and dependable.
| Impact assessed | Project detail or model assumption | Figure |
|---|---|---|
| Permanent installation | Proposed Alaska fiber route through wetlands | 52 cable access vaults |
| Modeled fixed wireless emissions | Grid carbon intensity 50% below model baseline | Under 22 kg CO₂e per household per year |
| Modeled fixed wireless emissions | Grid carbon intensity 50% above model baseline | 43 kg CO₂e per household per year |
Sources: National Telecommunications and Information Administration, Carbon Trust
How to Tell Whether the Investment Worked
Before approving funding, a ministry should ask where service falls short and compare designs that can fix it. A proposal for a new site in a remote settlement should show whether expected subscriptions can support maintenance after construction funding ends. Where an operator proposes replacing an aging line, it should show what can be reused and how customers would stay connected during the work. Reuse has value when it reduces construction while still delivering the service the region needs.
Once service begins, test it against the problem the investment was meant to solve. Where coverage expanded, subscriptions and household prices show whether people are taking up the new option. Where congestion drove the work, measure service when it used to fail. London’s benchmark for strong city service calls for at least 25 Mbps download and 8 Mbps upload, with latency of 50 ms or less. Compare actual construction disturbance and restoration with the original assessment. Operating electricity can be checked against the forecast as the network comes into regular use. Habitat effects warrant their own assessment even where a financial value is unavailable.
In Australia, a household still using satellite may never appear on a list of completed wireless upgrades. Yet it can benefit from capacity released by the households that moved. Counting only the new wireless connections would leave that gain out of the evaluation. The service received by households on both networks, and the resources required to sustain it, can help determine whether the next public dollar should extend wireless farther or improve service for the households it cannot reach.
| Objective | Record before approval | Verify after installation |
|---|---|---|
| Extend affordable access | Eligible premises and proposed monthly price | Active subscriptions and actual monthly price |
| Relieve congestion | Busy-hour speeds at affected sites | Speed tests at the same sites and hours |
| Free capacity on the existing network | Service limits on the existing network | Plans and performance for customers who stay |
| Limit land disturbance | Projected temporary and permanent footprint | Area disturbed and area restored |
Sources: U.S. Government Accountability Office, Australian Competition and Consumer Commission, NBN Co, National Telecommunications and Information Administration
TL;DR
- First access, better service, and modernization address different economic constraints.
- In 2026, 97% of the world’s population lived within reach of at least 3G, while 76% used the internet.
- Australia’s A$750 million program gave more than 120,000 premises a fixed wireless option. The operator reported that it also freed capacity for households that remained on satellite.
- Among 153 monitored Australian fixed wireless connections, downloads averaged 83.8% of maximum wholesale plan speed during weekday evening peaks.
- Indonesia’s Palapa Ring and London’s shared radios illustrate bottlenecks at different points in a network.
- The Italian firm study and Tanzanian household study show different ways broadband can contribute to prosperity.
- Alaska’s fiber assessment quantified projected temporary disturbance separately from permanent wetland impacts.
- The modeled emissions comparison between fiber and fixed wireless reversed between rural and suburban settings.
- Before funding a project, compare designs that can meet the same service need and account for what each requires to build and operate.
- After installation, check take-up, delivered service, operating costs, and environmental effects against the original proposal.
SOURCES
- International Telecommunication Union; Facts and Figures 2026: Global Internet Use and Mobile Network Coverage; – Link
- International Telecommunication Union; Internet Use in Urban and Rural Areas, 2026; – Link
- NBN Co; NBN Fixed Wireless Upgrade Program Completed for 800,000 Homes and Businesses; – Link
What Households Receive After the Work Is Done
- Australian Competition and Consumer Commission; Measuring Broadband Australia: Report 33, June 2026; – Link
- NBN Co; Half-Year Report 2026; – Link
- NBN Co; NBN Removes High Speed Requirement to Upgrade from Fibre to the Curb; – Link
- Ogutu B. Osoro, Edward J. Oughton, Andrew R. Wilson, and Akhil Rao; Emissions Assessment of Low Earth Orbit Broadband Megaconstellations: Starlink, OneWeb and Kuiper; – Link
Where the Network Falls Short of the Economy
- World Bank; Indonesia Economic Prospects, December 2025; – Link
- Regional Science and Urban Economics; Broadband Upgrade and Firm Performance in Rural Areas: Quasi-Experimental Evidence; – Link
- The World Bank Economic Review; Mobile Broadband, Poverty, and Labor Outcomes in Tanzania; – Link
- Costa Rica Superintendency of Telecommunications; Programa Hogares Conectados; – Link
The Costs a Construction Bid Leaves Out
- National Telecommunications and Information Administration; Alaska FiberOptic Project Environmental Assessment; – Link
- Carbon Trust; Comparative Carbon Footprint of Fibre-to-the-Home and Fixed Wireless Access; – Link
- European Union; Regulation (EU) 2024/1309, Gigabit Infrastructure Act; – Link
How to Tell Whether the Investment Worked
- Greater London Authority and Ookla; A New Lens on the Connected Capital: Mobile Network Performance in London; – Link
- U.S. Government Accountability Office; Broadband Deployment: Agencies Should Take Steps to Better Target Underserved Areas and Consider Sustainability; – Link
- National Telecommunications and Information Administration; BEAD Policy Notice: Performance Measures for BEAD Last-Mile Networks; – Link