The Connected Ocean
For most of modern economic history, the ocean has functioned as a vast blind spot—physically critical, commercially essential, yet informationally thin. Nearly 80% of it remains unmapped at high resolution, a reminder that scale, depth, and cost have long constrained visibility. That condition is beginning to shift. Satellite constellations, distributed sensors, and cloud-based analytics are extending digital reach into marine environments, turning what was once episodic observation into something closer to continuous awareness.
Less visible, but more consequential, is how that awareness is being translated into control. Marine systems are starting to be governed through data, and the question of who controls that data is no longer theoretical. It is emerging alongside the infrastructure itself.
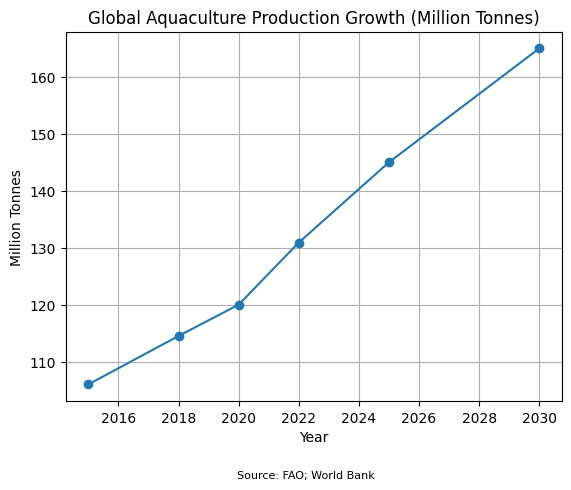
As ecological pressure intensifies, the timing of this transition becomes less incidental. Over 35% of global fish stocks are overexploited, while aquaculture now supplies roughly 56% of seafood consumed worldwide. These figures reflect a system already shifting toward managed production, where real-time information becomes foundational.
With more than 100,000 industrial fishing vessels now trackable via satellite, monitoring has crossed a practical threshold. What was once a fragmented and delayed process is moving toward continuous visibility. Coral reef systems are being observed in similar ways, with temperature anomalies detected early enough to anticipate bleaching events rather than simply document them.
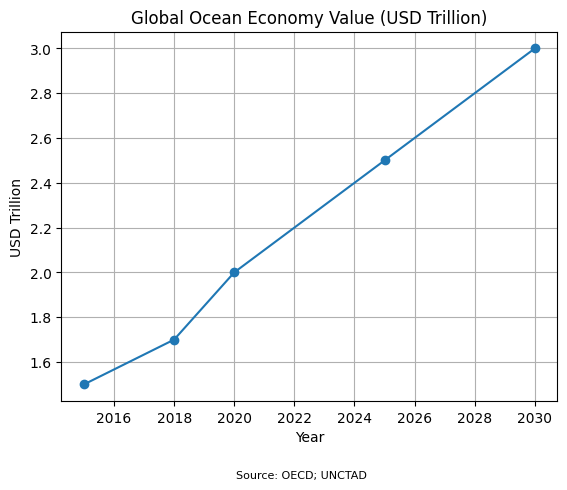
What emerges is not just a better-informed ocean, but a different kind of economic environment. The OECD estimates that the ocean economy could reach $3 trillion annually by 2030, increasingly shaped by data flows rather than physical proximity. The ocean is no longer an informational blind spot; it is becoming a networked domain within the digital economy.
Core Components of the Connected Ocean System
| Layer | Primary Technologies | Core Function | Operational Outcome |
|---|---|---|---|
| Sensing | Buoys, seabed sensors, autonomous underwater vehicles | Capture environmental variables (temperature, oxygen, salinity) | Continuous environmental visibility across ocean regions |
| Connectivity | LEO satellites, subsea cables, coastal relay nodes | Transmit data from remote marine environments | Near real-time global ocean data transmission |
| Analytics | Cloud computing, AI/ML models | Process and interpret large-scale datasets | Detection of anomalies and predictive modeling |
| Application Layer | Monitoring platforms, aquaculture systems, enforcement tools | Convert insights into operational decisions | Optimized resource use and improved compliance |
Source: NOAA; Global Fishing Watch; OECD
Core Systems and Capabilities
The architecture behind this transition is not defined by a single technology, but by the interaction between sensing, connectivity, and analytics—each expanding in scale, but more importantly, in coordination.
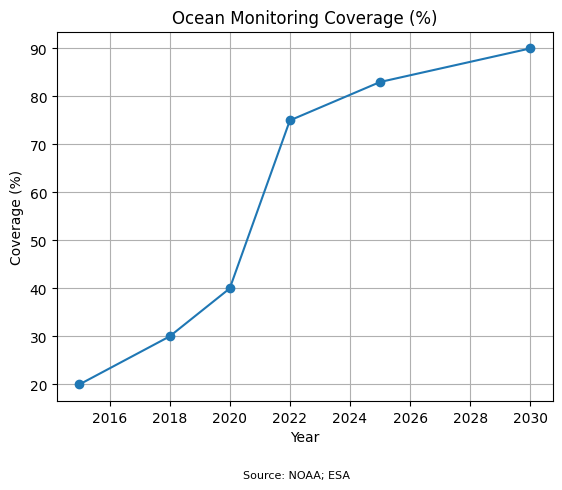
At the sensing level, the change is physical and distributed. NOAA’s ocean observing systems now incorporate more than 8,000 sensors globally, measuring variables such as temperature, oxygen levels, and salinity at a frequency that begins to approximate continuity. These are not isolated instruments; they form an expanding mesh of environmental awareness across regions that were previously sampled only intermittently.
What connects them is less visible, but more consequential. Subsea cable networks—over 500 active systems worldwide—carry roughly 99% of international data traffic, linking coastal monitoring points to global computing environments. Overlaying this, low-earth orbit satellite constellations are closing coverage gaps across open ocean regions.
Rather than simply increasing data volume, this connectivity is altering system behavior. Analytical models now operate on datasets large enough to detect patterns rather than isolated events. A 2023 study demonstrated that industrial fishing activity is detectable across more than 75% of the ocean surface using satellite data.
Coral restoration provides a localized but revealing example. The Great Barrier Reef has lost approximately half of its coral cover since the 1990s, prompting a shift toward data-informed intervention. AI-assisted mapping and sensor feedback loops are guiding where restoration efforts are deployed, improving survival outcomes under thermal stress in early trials.
In aquaculture, the transition is already operational. Production is projected to grow by over 30% by 2030, supported by precision monitoring systems. Sensor-driven feeding platforms can reduce feed waste by up to 30%, improving both cost efficiency and environmental performance.
Connected Ocean Use Cases by Sector
| Sector | Use Case | Technology Integration | Primary Outcome |
|---|---|---|---|
| Coral Reef Conservation | Bleaching detection and targeted restoration | Satellite imaging, AI mapping, sensor feedback | Earlier intervention and improved restoration targeting |
| Fisheries Enforcement | Detection of illegal and untracked vessels | AIS data, satellite tracking, machine learning | Increased transparency and enforcement capability |
| Aquaculture | Precision feeding and health monitoring | IoT sensors, automation systems | Improved yields and reduced environmental impact |
| Climate Monitoring | Ocean temperature and acidification tracking | Distributed sensors, cloud analytics | Enhanced forecasting and policy planning |
| Insurance & Risk | Coastal risk modeling and forecasting | Geospatial analytics, predictive models | Improved pricing of environmental and maritime risk |
Source: World Bank; FAO; McKinsey Global Institute
Ecosystem and Industry Implications
As connectivity deepens, its effects begin to surface unevenly—first in ecosystems, then in the industries that depend on them.
In coastal regions where monitoring has historically lagged, harmful algal blooms have increased in frequency by over 60% over the past three decades. With integrated satellite and sensor systems, detection now occurs earlier, shifting response from reactive to anticipatory.
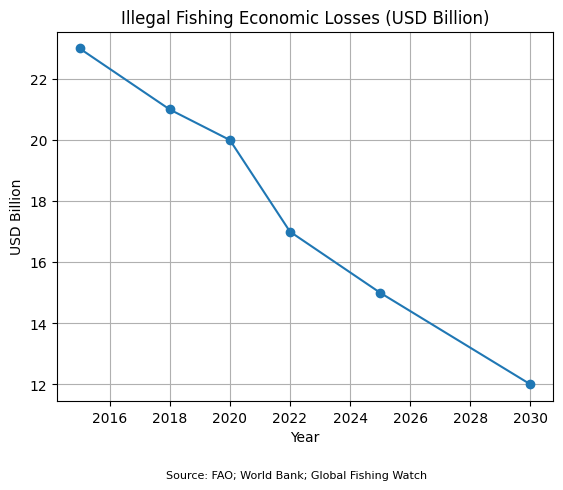
What was once operational anonymity in fisheries is narrowing. Satellite monitoring now covers more than 75% of the ocean surface, while AIS data increasingly exposes previously untracked “dark vessels.” The estimated $10–23 billion lost annually to illegal fishing is not eliminated, but the conditions that sustained it are weakening.
At the same time, aquaculture is scaling under a different model of control. Norway’s production of over 1.5 million tonnes of farmed salmon annually reflects a system where continuous monitoring supports both yield stability and environmental compliance.
More quietly, the economic center of gravity is beginning to shift. The global geospatial analytics market is projected to exceed $200 billion by 2030, with ocean data forming a growing component. Environmental intelligence is now used to price risk, anticipate supply changes, and guide investment decisions.
Yet this transition is not evenly distributed. Small-scale fisheries, which account for roughly 90% of global fishing employment, often operate without access to these systems. The result is a widening divergence in how marine resources are monitored, valued, and governed.
Governance, Economics, and Strategic Outlook
As ocean systems become digitally integrated, governance challenges are shifting toward infrastructure control, data ownership, and system resilience.
Less discussed, but increasingly central, is the concentration of the infrastructure itself. A small number of firms control a significant share of satellite networks and cloud computing capacity, with the top three cloud providers accounting for over 60% of the global market. Marine systems are beginning to depend on platforms that operate beyond national control.
Across jurisdictions, data sovereignty is moving from theory to practice. More than 90% of global data flows pass through infrastructure located in a limited number of countries, while ocean data collected within national waters is often processed externally. Questions of access and control are becoming operational rather than conceptual.
What remains unresolved is how ocean data is classified. It carries characteristics of a public good, yet is increasingly monetized as a private asset. Multilateral efforts are emerging, but no unified framework governs ownership or interoperability.
At the same time, connectivity introduces new vulnerabilities. Maritime cyber incidents have increased by more than 400% since 2017, exposing risks across vessel tracking systems, aquaculture platforms, and environmental monitoring networks.
Without these systems, the counterfactual is clear. Historically, more than 70% of illegal fishing occurred beyond effective monitoring range, while environmental response lagged behind observable change. Connectivity reduces these gaps, but replaces them with new dependencies.
Looking ahead, integration is likely to deepen. By 2035, autonomous and semi-autonomous systems are expected to manage significant portions of offshore monitoring and aquaculture operations, supported by continuous data streams and predictive analytics.
The economic potential remains substantial. The ocean economy is projected to reach $3 trillion annually by 2030, driven in part by digitalization. But the distribution of that value—and the control mechanisms behind it—remains unsettled.
The ocean is no longer defined by distance or depth alone. It is increasingly defined by the systems that observe it—and the entities that control those systems.
Governance and Risk Dimensions of Ocean Connectivity
| Dimension | Description | Key Stakeholders | Strategic Implication |
|---|---|---|---|
| Infrastructure Concentration | Reliance on a limited number of satellite and cloud providers | Technology firms, governments, maritime operators | Concentration of operational control and dependency risk |
| Data Sovereignty | Data collected locally but processed across borders | National governments, regulators | Unclear jurisdiction and access control challenges |
| Data Ownership | Unresolved classification between public good and private asset | Private platforms, multilateral institutions | Fragmentation of access and potential monetization conflicts |
| Cybersecurity | Exposure of connected marine systems to cyber threats | Shipping firms, aquaculture operators, defense agencies | Operational disruption and environmental risk |
| Access Inequality | Uneven adoption across regions and operator scale | Developing nations, small-scale fisheries | Widening economic and sustainability disparities |
Source: International Maritime Organization; UNCTAD; OECD
Key Takeaways
- Nearly 80% of the ocean remains unmapped, but digital infrastructure is rapidly expanding visibility.
- Over 35% of fish stocks are overexploited, while aquaculture supplies about 56% of global seafood.
- More than 100,000 fishing vessels are now trackable via satellite systems.
- Ocean observing networks include over 8,000 sensors globally.
- Subsea cables carry approximately 99% of international data traffic.
- Satellite analytics detect fishing activity across more than 75% of the ocean surface.
- Harmful algal blooms have increased by over 60% in some regions.
- The ocean economy could reach $3 trillion by 2030.
Sources
- Food and Agriculture Organization; The State of World Fisheries and Aquaculture 2024; – Link
- OECD; The Ocean Economy in 2030; – Lin
- World Bank; Aquaculture Overview and Growth Projections; – Lin
- NOAA; U.S. Integrated Ocean Observing System; – Link
- Global Fishing Watch; Monitoring Industrial Fishing Activity; – Link
- Nature; Tracking the Global Footprint of Industrial Fishing; – Link
- Great Barrier Reef Foundation; Reef Restoration and Adaptation Program; – Link
- TeleGeography; Submarine Cable Map and Industry Data; – Link
- UNCTAD; Digital Economy Report and Global Data Flows; – Link
- BIMCO; Maritime Cyber Security Report 2023; – Link
- McKinsey Global Institute; Geospatial Analytics and Economic Value; – Link
- Reuters; AI Satellites for Coral Reef Monitoring; – Link