Australia and New Zealand enter the second half of 2026 from a position of near-universal digital access. The region is no longer trying to bring the internet to the economy; it is trying to integrate the internet more deeply into economic activity and capture the efficiencies it can create. With penetration already above 96% in both countries, the central test has moved from connection to coordination and implementation.


Distance gives this internet economy its character. In two advanced markets where people, resources, firms, and institutions are spread across large physical space and limited global-market scale, digital systems carry unusual weight. A digital service is not only a convenience. It is a way of making distance less costly. A connected clinic, a remote industrial operation, and a resilient public service all express the same condition: digital maturity becomes valuable when separation becomes workable coordination.
Australia moves a step ahead because digital capability has reached macroeconomic scale. Its technology sector reached A$248.5 billion in 2025, equal to 8.9% of GDP. That scale gives Australia deeper infrastructure capacity, stronger investment depth, and greater leverage over the rules that shape digital markets.

New Zealand faces the same transition with thinner buffers, but its smaller institutional scale can make coordination faster when policy, infrastructure, and service delivery move together. Its e-commerce market is forecast to reach NZ$17.6 billion by 2028, showing that the smaller economy is also moving from access into deeper digital participation.
Mature internet access has become the operating condition for markets that cannot depend on density alone. Digital maturity becomes success only when it produces durable productivity, usable services, trusted transactions, resilient infrastructure, and public value across the whole regional economy.
| Core Regional Position | ||||
|---|---|---|---|---|
| Name | 2025 | 2026 (est)* | % Growth | Source |
| Australia internet users | 26.2M | 26.2M | 0.0% | DataReportal |
| New Zealand internet users | 5.06M | 5.06M | 0.0% | DataReportal |
| Australia technology sector contribution | A$248.5B | A$250B+ | 0.6%+ | Tech Council of Australia |
| Australia technology share of GDP | 8.9% | ~9.0% | +0.1 pp | Tech Council of Australia |
From Digital Access Into Economic Absorption
Mature Access, Uneven Participation
The access layer is mature, but the participation layer remains uneven. New Zealand’s fiber network reaches about 87% of the population, with median fixed broadband speeds of 254.33 Mbps download and 150.71 Mbps upload as of June 2024. These figures establish a high-capacity access base. They also sharpen the real question: whether households, firms, and public institutions can use that access confidently enough to change economic behavior.
Market access now runs through digital reliability. A small firm does not compete because it has broadband. It competes when the trust mechanisms behind a transaction work without hidden burdens. A household does not gain full digital access because a service exists online. It gains when the service is usable, secure, and consistent. A clinic does not become digitally capable because telehealth is available. It becomes capable when clinical practice fits the channel.
New Zealand’s projected NZ$17.6 billion e-commerce market by 2028 makes the participation point concrete. Australia supplies more regional scale, while New Zealand shows the same reliability test under tighter margins. The shared pattern is clear: access is no longer the scarce asset; dependable use is.

Digital finance gives participation its trust layer. Once commerce moves online, payments and verification become economic infrastructure rather than a narrow fintech category. Reliable digital finance lets small firms sell beyond local reach, allows households to trust remote transactions, and gives institutions a way to confirm activity without slowing it down. In Australia, this layer benefits from larger capital markets and deeper platform participation. In New Zealand, it carries higher relative importance because a smaller market depends more heavily on confidence, interoperability, and low-friction access to external demand.

The region’s digital divide has shifted accordingly. It is no longer mainly between the connected and the unconnected. It is between those who can turn connection into reliable participation and those who inherit complexity from systems they did not design.
| Access and Market Participation | ||||
|---|---|---|---|---|
| Name | 2025 | 2026 (est)* | % Growth | Source |
| Australia internet penetration | 97.1% | 97.1% | 0.0 pp | DataReportal |
| New Zealand internet penetration | 96.2% | 96.2% | 0.0 pp | DataReportal |
| New Zealand fiber population coverage | 87% | 87%+ | n/m | U.S. ITA |
| New Zealand e-commerce market | ~NZ$14.4B | ~NZ$15.4B | 7.1% | U.S. ITA |
AI, Cloud, and Productivity
Compute Becomes the New Physical Infrastructure
Cloud, AI, and IaaS have become the processing base of the regional internet economy. The practical dependence is larger than any single technology label. Organizational data, software operations, model deployment, and digital-service delivery now sit on a compute layer that behaves like infrastructure. Australia’s deployable data-center capacity is projected to rise from 1,350MW in 2024 to 3,100MW by 2030, backed by more than A$26 billion in forecast investment. Compute has become a physical planning issue. Digital growth now needs power-system capacity, suitable land, secure facilities, and public legitimacy.
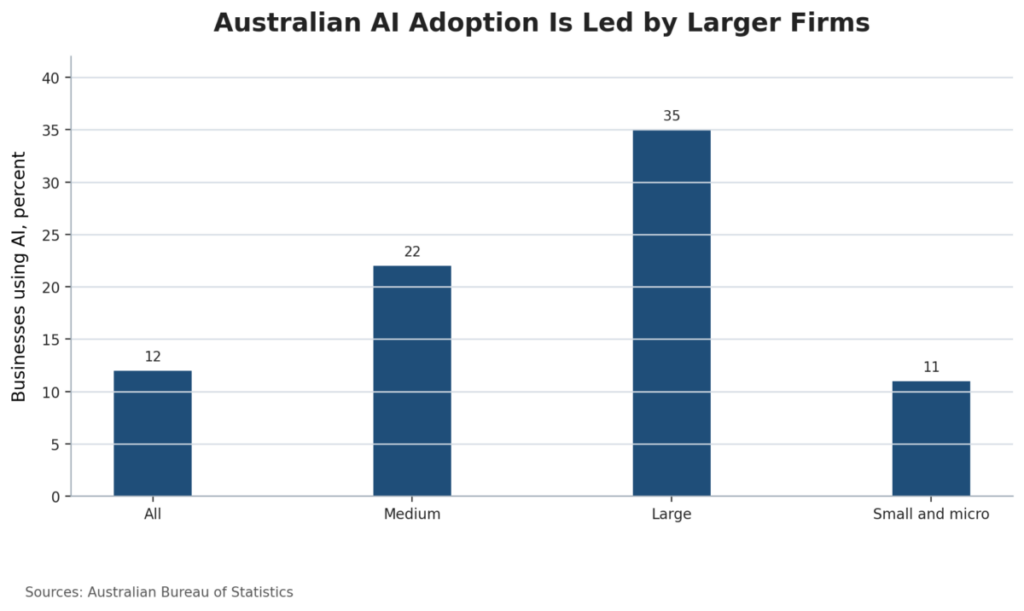
AI gives that infrastructure its economic use. Business AI adoption in Australia rose from 1% in 2022–23 to 12% in 2024–25. The headline gain is large, but the distribution is more important. Adoption reached 35% among large businesses, 22% among medium businesses, and remained close to 11% among small and micro businesses. The result is not only an innovation story. It is a productivity-distribution problem.
New Zealand faces the same compute transition with a sharper dependency test. Its fiber base gives it strong digital reach, but its smaller market has less bargaining power over the external platforms and cloud systems that increasingly supply the operating layer of the economy. Smaller scale can make institutional coordination easier, but it also makes imported infrastructure pricing and vendor dependence more visible. New Zealand’s digital maturity therefore depends on domestic capability and on the terms under which global systems are absorbed.
| Cloud, AI, and Compute Infrastructure | ||||
|---|---|---|---|---|
| Name | 2025 | 2026 (est)* | % Growth | Source |
| Australia data-centre capacity | ~1,551MW | ~1,781MW | 14.9% | Mandala Partners |
| Australia data-centre investment pipeline | A$26B+ by 2030 | A$26B+ by 2030 | n/m | Mandala Partners |
| Australian business AI adoption | 12% | ~18% | ~50% | ABS |
| Large-business AI adoption | 35% | ~43% | ~23% | ABS |
| Small and micro business AI adoption | ~11% | ~16% | ~45% | ABS |
Sectors, Commerce, and Industrial Systems
High-Friction Sectors Prove the Value
The strongest use cases appear where distance, risk, and coordination costs are highest. Health provides the clearest human proof. Australia’s 100 million-plus telehealth services, 17 million users, A$5 billion-plus in Medicare benefits, and 92,000-plus practitioners show that digital care moved beyond emergency substitution into ordinary service delivery. Telehealth changed the cost of access outside major centers. Digital continuity of care depends on information reaching the clinician as reliably as the patient does. AI-supported triage and workflow can redirect scarce capacity toward higher-value care when institutional safeguards are strong enough to carry public trust.
The health case also gives the region a public-value frame. Digital maturity is achieved when connectivity creates social value: when people can reach care, government support, emergency information, and essential services without being punished by distance, age, disability, or administrative complexity. Rural access and ageing populations make that test sharper. A digital public service that merely moves forms online is not enough. A digital public service that reduces the burden of reaching the state becomes part of the region’s social infrastructure.
The physical economy makes the same argument from the production side. In 2024–25, 59% of Australian businesses reported supply-chain disruptions, and 15% said those disruptions significantly hampered general business activity or performance. Those figures turn connected operations into a productivity issue. In a region where distance shapes cost, the ability to see trouble early and coordinate movement before disruption hardens into loss becomes an economic advantage.

Australia has the scale to apply that logic across the physical economy, where remote assets and long supply chains turn information delay into economic cost. The point is not that more industries are “going digital.” Digital systems are changing the cost structure of sectors where timing and visibility decide margins. A disrupted supply chain becomes less damaging when firms can adapt before the delay reaches the balance sheet. A dispersed workforce becomes more productive when decisions no longer require everyone to share the same place.
New Zealand’s version is smaller but not weaker in significance. A compact economy can align institutions quickly when incentives are clear, and a strong fiber base gives the country a high-quality foundation for digital integration. For New Zealand, the digital transformation of the physical economy is both an efficiency strategy and a dependency-management problem.
| High-Friction Sectors and Digital Coordination | ||||
|---|---|---|---|---|
| Name | 2025 | 2026 (est)* | % Growth | Source |
| Telehealth service base | 100M+ services | Institutionalized channel | n/m | Health.gov.au |
| Telehealth population reach | 17M people | Ongoing service base | n/m | Health.gov.au |
| Medicare telehealth benefits paid | A$5B+ | Embedded funding path | n/m | Health.gov.au |
| Businesses with supply-chain disruptions | 59% | ~59% | 0.0 pp | ABS |
| Businesses significantly hampered by supply chains | 15% | ~15% | 0.0 pp | ABS |
Governance, Regulation, and Digital Sovereignty
Trust Becomes the Operating Boundary
Trust has become an economic condition, not a technical afterthought. A household, firm, clinic, or public agency can only participate confidently when the digital environment is dependable enough for ordinary use. Cybersecurity is now the price of participation in the regional internet economy.
New Zealand’s 2026–2030 cyber strategy places cyber threats among the country’s top five national-security issues, while 62% of New Zealanders want more information about national-security threats. The point is not only security awareness. It is economic confidence. Digital systems can only carry more activity when users believe those systems are safe, reliable, and governable.
The AI-cyber link raises the stakes. The June 2026 Five Eyes warning placed Australia and New Zealand inside a shared security environment where frontier AI models are expected to elevate offensive and defensive cyber capability within months. The same compute layer that supports transactions, care delivery, public administration, and remote operations also widens the attack surface.
As the region depends more heavily on cloud and connected infrastructure, cyber resilience becomes a productivity input. Trust is no longer separate from digital growth. It is the boundary that determines how much of the economy can safely move online.
Governance is the institutional side of the same boundary. In Australia and New Zealand, digital sovereignty does not mean isolation from global platforms. It means bargaining power inside dependence. Australia’s Digital Experience Policy became mandatory on January 1, 2025, while the responsible-use policy for AI in government took updated effect on December 15, 2025. These policies matter because the state is no longer only digitizing services. It is setting expectations for service quality, oversight, impact assessment, and public legitimacy.
Regulation also shapes market participation. Clear standards can reduce the trust cost of digital adoption, especially for smaller firms that cannot build governance systems from scratch. Poorly designed rules can do the opposite, shifting compliance complexity onto the organizations digital systems are meant to empower. The region’s regulatory challenge is to make trust usable: lowering uncertainty without freezing adaptation.
Australia enters that challenge with more regulatory capacity and greater domestic market weight. New Zealand enters with a smaller institutional field where coordination can move faster, but external dependence can be harder to offset. In both countries, public legitimacy will determine how far digital systems can move into sensitive parts of the economy.
| Cybersecurity, Governance, and Public Trust | ||||
|---|---|---|---|---|
| Name | 2025 | 2026 (est)* | % Growth | Source |
| New Zealand cyber threat ranking | Top-five issue | Top-five issue | n/m | New Zealand DPMC |
| New Zealand public demand for security information | 62% | 62% | 0.0 pp | New Zealand DPMC |
| Five Eyes AI-cyber risk horizon | Emerging | Months, not years | n/m | Five Eyes / ACSC |
| Australia Digital Experience Policy | Mandatory | In force | n/m | Digital.gov.au |
| Australia responsible-use AI policy | Updated Dec. 2025 | In force | n/m | Digital.gov.au |
Risk, Resilience, and Strategic Infrastructure
Strategic Dependence Sets the Regional Limit
The region’s risk profile now runs through the same systems that make digital coordination valuable. Compute dependence concentrates exposure. Platform reliance shapes bargaining power. Cyber risk turns ordinary participation into a security question. Energy demand makes digital expansion visible to the grid. These are not separate risks. They are the shadow side of digital maturity.
Australia has more room to absorb these pressures because its market is larger, its infrastructure pipeline is deeper, and its policy machinery carries more weight. But scale is already testing that capacity. Data-centre electricity demand is estimated to rise from about 3.9 TWh in 2025 to about 4.9 TWh in 2026, a 25% increase. Australia’s data-centre capacity is also expected to grow from roughly 1,551 MW to 1,781 MW, up 14.9%. Digital expansion is therefore becoming a power, infrastructure, and resilience question.
New Zealand tests the same model under tighter conditions. Its high access base and compact institutions can support fast adaptation, but smaller scale makes external dependence harder to dilute. Its cyber threat ranking remains a top-five national-security issue, showing how digital dependence has become part of the national-risk environment.
Strategic resilience will depend on whether the region can keep digital growth from becoming brittle. Cyber protection must mature alongside AI-enabled threats. Data-centre expansion must fit the power system. Public services must remain usable as digital channels become the default interface. Small firms must also be able to participate without inheriting complexity built for larger actors. The business AI diffusion gap shows the risk: large firms report adoption at 35%, while small firms sit closer to 11%, and that gap is expected to persist.
In Australia and New Zealand, resilience is no longer only the ability to recover from shocks. It is the ability to keep coordination affordable as the digital economy becomes more demanding.
| Strategic Infrastructure, Exposure, and Resilience | ||||
|---|---|---|---|---|
| Name | 2025 | 2026 (est)* | % Growth | Source |
| Data-centre electricity demand | ~3.9TWh | ~4.9TWh | 25% | AEMO |
| Australia data-centre capacity | ~1,551MW | ~1,781MW | 14.9% | Mandala Partners |
| Business AI diffusion gap | 35% large vs ~11% small | Gap persists | n/m | ABS |
| New Zealand cyber threat ranking | Top-five issue | Top-five issue | n/m | New Zealand DPMC |
Outlook
Second-Half Outlook: Coordination, Not Connection
The second half of 2026 will test whether Australia and New Zealand can turn digital maturity into coordinated economic performance. The access base is in place, investment is visible, and policy machinery is moving. The harder question is whether productivity can spread beyond the technology sector, cyber resilience can keep pace with exposure, compute growth can earn energy legitimacy, and public services can become easier to use rather than merely more digital.
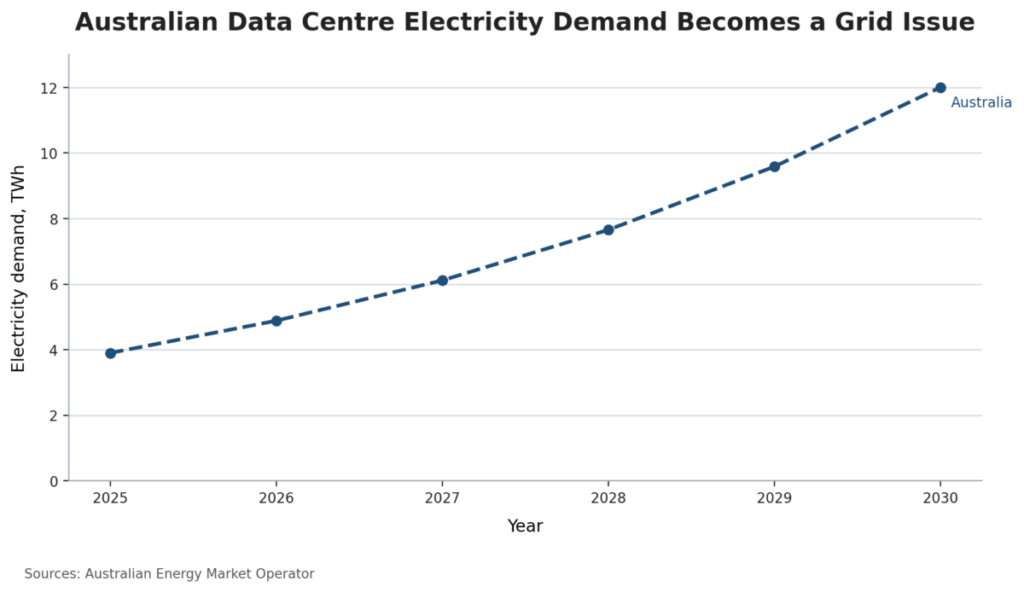
Australia enters this phase with more capital, deeper infrastructure, broader research capacity, and stronger regulatory leverage. Its technology sector reached A$248.5 billion in 2025 and is estimated to exceed A$250 billion in 2026. Yet the wider absorption test remains uneven: innovation-active businesses hold near 46%, while data-center energy demand is projected to rise from about 3.9 TWh to 4.9 TWh, a 25% increase.
New Zealand enters with high access, strong fiber coverage, and a smaller operating base where implementation mistakes carry higher relative cost. Its e-commerce market is estimated to grow from about NZ$14.4 billion in 2025 to NZ$15.4 billion in 2026, a 7.1% increase. That growth shows participation, but also reinforces the same constraint: smaller scale makes coordination valuable and dependence harder to dilute.
The two countries are not moving through separate digital cycles. They are operating inside one regional internet economy where distance makes coordination valuable, scale determines bargaining power, trust determines adoption, and energy determines the limit of growth.
By year-end 2026, the strongest signal will not be another access milestone. It will be evidence that ordinary firms can absorb AI, data-centre growth can fit the power system, digital public services can reduce burden, and New Zealand’s smaller scale can become a coordination advantage rather than a bargaining weakness. The region is not short of internet access. It is short of guaranteed absorption. That is the difference between being connected and being coordinated.
| Absorption and Constraint | ||||
|---|---|---|---|---|
| Name | 2025 | 2026 (est)* | % Growth | Source |
| Australia technology-sector scale | A$248.5B | A$250B+ | 0.6%+ | Tech Council of Australia |
| Australian innovation-active businesses | 46% | ~46% | 0.0 pp | ABS |
| Data-centre energy demand path | ~3.9TWh | ~4.9TWh | 25% | AEMO |
| New Zealand e-commerce market | ~NZ$14.4B | ~NZ$15.4B | 7.1% | U.S. ITA |
Sources
- DataReportal; Digital 2026: Australia; – Link
- DataReportal; Digital 2026: New Zealand; – Link
- DataReportal; Digital 2026: Global Overview Report; – Link
- Tech Council of Australia; Technology Becomes Australia’s Productivity Engine as Sector Hits $250 Billion; – Link
From Digital Access Into Economic Absorption
- Australian Competition and Consumer Commission; Broadband Performance Data; – Link
- U.S. International Trade Administration; New Zealand — Digital Economy; – Link
- U.S. International Trade Administration; New Zealand — eCommerce; – Link
AI, Cloud, and Productivity
- Mandala Partners; Empowering Australia’s Digital Future; – Link
- Australian Bureau of Statistics; Business Adoption of Artificial Intelligence Accelerates in 2024–25; – Link
- Australian Energy Market Operator; Digital Demand Surge: Preparing Australia’s Power Systems for the Data Centre Boom; – Link
Sectors, Commerce, and Industrial Systems
- Australian Government Department of Health and Aged Care; Telehealth Hits 100 Million Services Milestone; – Link
- Australian Bureau of Statistics; Characteristics of Australian Business, 2024–25; – Link
Governance, Regulation, and Digital Sovereignty
- New Zealand Department of the Prime Minister and Cabinet; New Zealand’s Cyber Security Strategy 2026–2030; – Link
- Five Eyes Cyber Security Agencies; Five Eyes Cyber Security Agencies Statement; – Link
- Australian Government Digital Transformation Agency; Digital Experience Policy; – Link
- Australian Government Digital Transformation Agency; AI Policy Update: Strengthening Responsible Use Across Government; – Link
Risk, Resilience, and Strategic Infrastructure
- Australian Energy Market Operator; Digital Demand Surge: Preparing Australia’s Power Systems for the Data Centre Boom; – Link
- Mandala Partners; Empowering Australia’s Digital Future; – Link
- Five Eyes Cyber Security Agencies; Five Eyes Cyber Security Agencies Statement; – Link
Outlook
- Tech Council of Australia; Technology Becomes Australia’s Productivity Engine as Sector Hits $250 Billion; – Link
- Australian Bureau of Statistics; Characteristics of Australian Business, 2024–25; – Link
- Australian Energy Market Operator; Digital Demand Surge: Preparing Australia’s Power Systems for the Data Centre Boom; – Link
Keywords: Australia Internet Economy, New Zealand Digital Economy, Regional Digital Coordination, Digital Infrastructure, AI Adoption, Cloud Computing, Data Centres, Digital Sovereignty
Country List: Australia, New Zealand