

AI may appear to exist in software, but its economic output depends on chips, electricity, cooling, networks, and the infrastructure that supports them. Yet the public image of data centers remains tied to older facilities with heavy cooling and water demands, even as AI pushes operators toward denser and more efficient designs.
The scale of the concern is real.
Worldwide, data-center electricity demand is projected to grow by about 15 percent each year and reach roughly 945 TWh by 2030.
| Period | Electricity Scale | Change in Pressure | Primary Exposure |
|---|---|---|---|
| 2014 | 58 TWh in the U.S. | Conventional fleet baseline | Operating efficiency |
| 2023 | 176 TWh; 4.4% of U.S. use | More than 3× the 2014 load | Grid and water scrutiny |
| 2027 | Up to 68 GW globally | AI capacity becomes strategic | National dependence |
| 2028 | 325–580 TWh in the U.S. | About 1.8–3.3× the 2023 load | Power, permits, financing |
| 2030 | About 945 TWh globally | Roughly 2× the 2024 level | Infrastructure competition |
Sources: Berkeley Lab, U.S. Department of Energy, International Energy Agency, RAND Corporation
The Feared Data Center Belongs to an Earlier Era
The familiar image of a data center filled with hot servers and industrial cooling equipment is historically accurate. Many facilities relied on room-level air cooling, chilled-water systems, and evaporative heat rejection because those designs suited the processing densities and engineering assumptions of their time. Cities already contain office-sized computing centers that operate largely unnoticed. AI facilities are much larger, but data centers have long existed within urban environments; the fact that they already exist among us should not go unmentioned.
This burden should not be confused with the claim that every modern facility must consume large volumes of cooling water on site. A project can reduce evaporation while retaining an indirect footprint through electricity use. It may also appear efficient at the national level while placing severe pressure on a particular watershed, which is part of the main political issue.
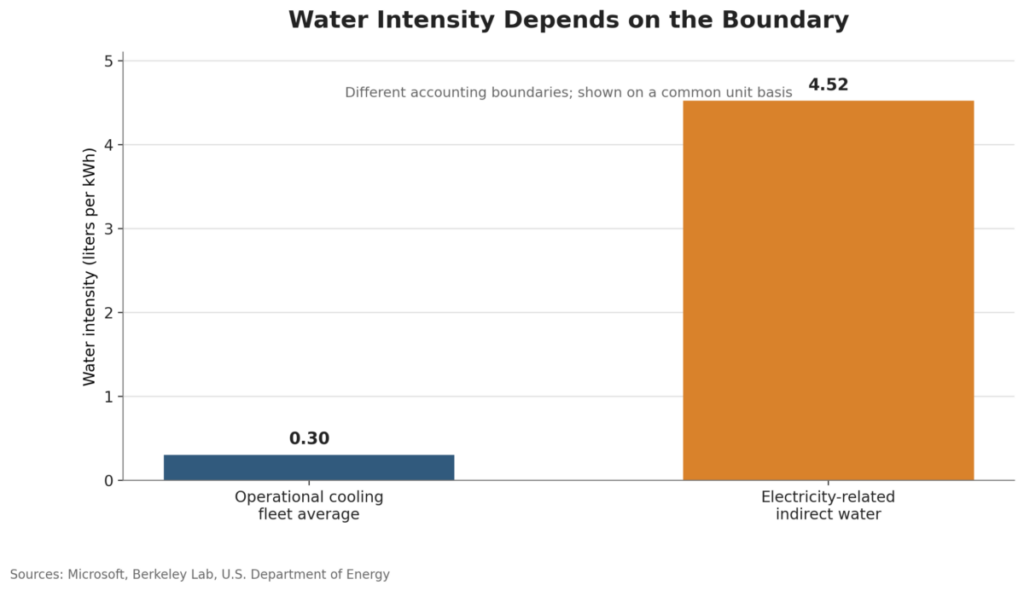
Operational cooling represents only part of AI’s water footprint. Electricity generation and semiconductor manufacturing add substantial indirect demand, as do construction and equipment production. In 2023, electricity used by U.S. data centers was associated with nearly 800 billion liters of indirect water consumption, or about 4.52 liters per kilowatt-hour. That national average masks wide regional differences in the water intensity of electricity.
Scale further complicates the comparison. A cooling method that is efficient per calculation can still become environmentally significant when deployed across millions of servers or concentrated in a water-stressed region. Total consumption can rise even as resource intensity falls if computing demand grows faster than efficiency improves.
Estimates of water use per AI query are equally sensitive to context. Results vary with the model, hardware, workload, cooling system, climate, electricity source, and accounting method.
For example, training a frontier model is not comparable to generating a short text response because the computational demands are different. Although the systems are advanced, they use different methods and algorithms for different tasks. A single average cannot be applied to the entire system at an arbitrary interval, such as once a month, and treated as meaningful through simple division. – This hardly captures the truth about “a single chat prompt consumes a tablespoon of water”.
Water accounting must also distinguish withdrawal from consumption. Withdrawal measures water removed from a source, while consumption measures water not promptly returned, usually because it evaporates. Treating the two as interchangeable can exaggerate or obscure local effects.
An 8088 computer and flip-phones remain historically real, but no longer describe current capability. The same is becoming true of the legacy data center.
| Measure | What It Captures | Typical Boundary | Main Source of Variation |
|---|---|---|---|
| Withdrawal | Water removed from a source | Facility or utility | Return flow |
| Consumption | Water not promptly returned | Cooling process | Evaporation |
| On-site water | Facility cooling demand | Property boundary | Cooling design and climate |
| Indirect water | Electricity-related demand | Regional power system | Generation mix |
| Workload intensity | Resources per computation | Model and facility | Hardware and utilization |
Sources: Berkeley Lab, Google
Many of the Problems Have Already Been Reduced
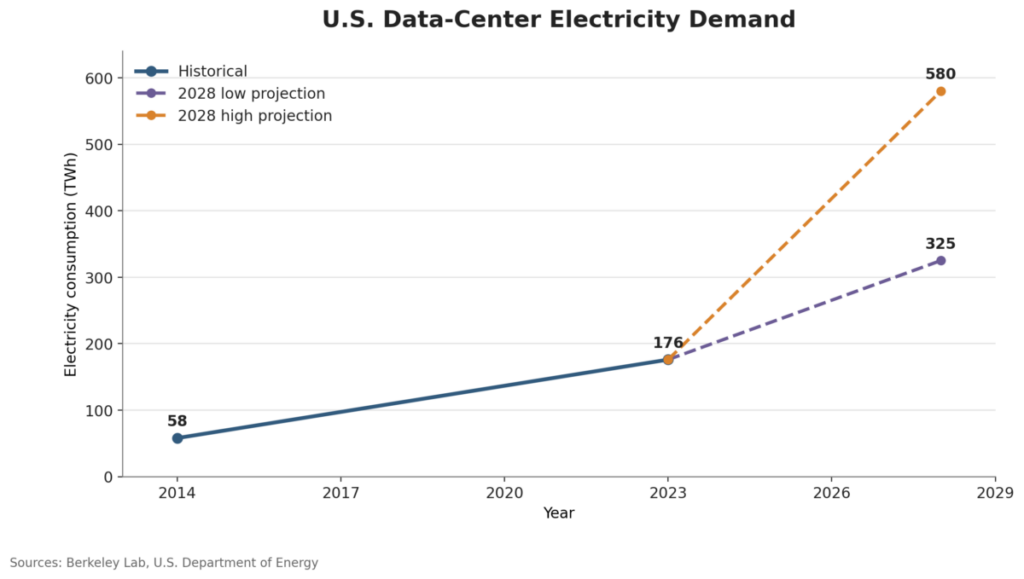
The scale of electricity use makes even incremental gains economically material. U.S. data-center consumption rose from 58 TWh in 2014 to 176 TWh in 2023, an increase of more than threefold in nine years. At that scale, small improvements in cooling efficiency, workload placement, or hardware utilization can alter operating costs across an entire fleet.
Because advanced AI capacity is concentrated among large cloud and technology operators, a design adopted as a fleet standard can spread across substantial computing capacity. The incentive is direct: wasted power, water, cooling capacity, or installed hardware makes computation more expensive and the underlying asset less competitive.
| Modernization Channel | System Level | Primary Effect | Deployment Signal |
|---|---|---|---|
| Processor replacement | Hardware | More compute per watt | Routine refresh cycle |
| Workload consolidation | Operations | Higher utilization | Fewer idle systems |
| Airflow controls | Facility | Lower fan and cooling load | Staged retrofit |
| Hybrid liquid cooling | High-density racks | Targeted heat removal | Above 100 kW |
| Fleet standardization | Operator portfolio | Rapid diffusion | Hyperscale adoption |
Sources: Google, Uptime Institute, ASHRAE, Berkeley Lab
The Modern Data Center Is a Whole System Redesign
For operators, site design now links engineering performance to public capacity. A cooling system that works efficiently in one climate may impose unacceptable water or power costs in another, even when the underlying hardware is identical.
Environmental efficiency and environmental capacity are not the same. A facility can use less water per unit of compute and still exceed a watershed’s limits because of its total scale. Efficiency determines resource intensity; geography and scale determine whether the impact is locally sustainable.
Location has become part of the product. Climate and watershed conditions determine cooling performance, while grid capacity, electricity sources, permitting, and network access shape economic viability. Reclaimed water can reduce pressure on drinking supplies, but treatment, pumping, and evaporative loss still carry costs. Captured heat can serve nearby buildings or industrial users where distance and year-round demand make reuse practical.
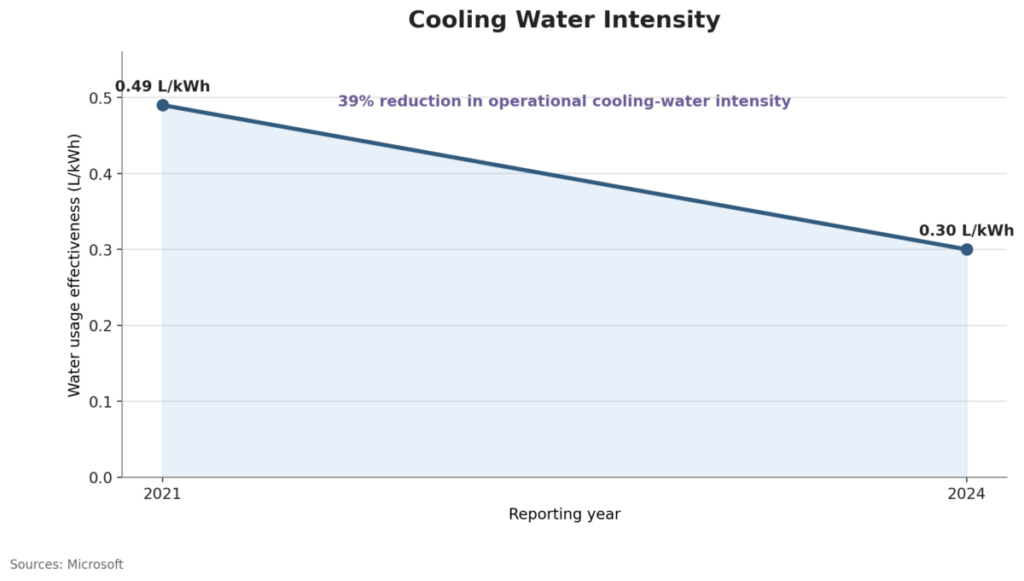
Water is commonly used for cooling, but the process is often misunderstood. In a closed-loop system, liquid can circulate through servers without being consumed. The heat it collects must still be released outside the facility. Cooling towers do this partly through evaporation, while dry coolers transfer heat to the air with little routine water use. During extreme heat, however, dry cooling may require more electricity and shift part of the water demand to the power system.
Direct-to-chip cooling addresses a different part of the process. It captures heat at the processor instead of relying mainly on fans and cooled room air. The circulating liquid may still release that heat through either a cooling tower or a dry system. At rack densities above 100 kW, this approach changes the design of the entire facility. Systems approaching 300–400 kW per rack require tightly coordinated cooling and power infrastructure, supported by stronger networks and structures.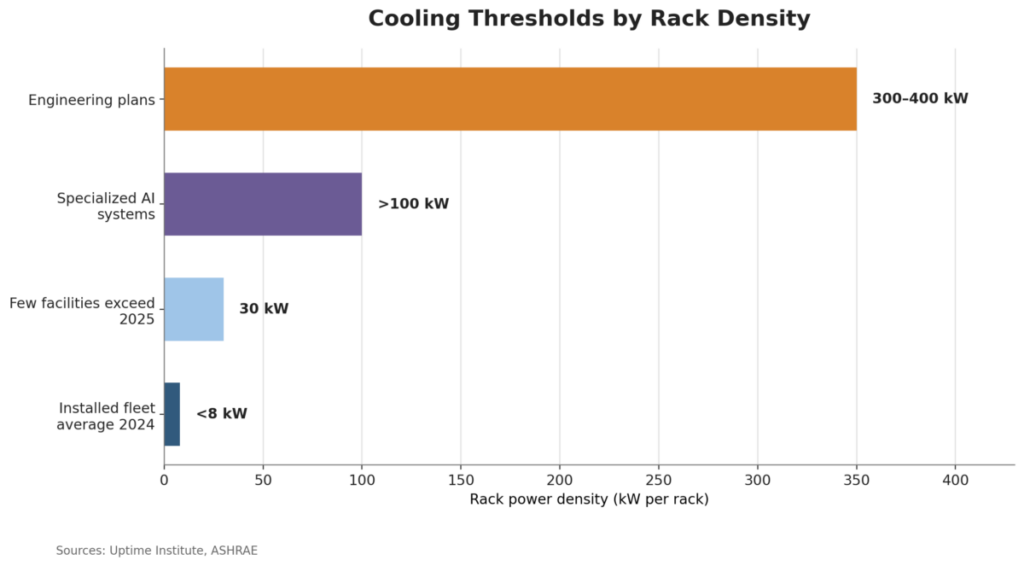
Some newer designs combine direct-to-chip cooling with dry heat rejection, eliminating evaporative water use during normal operation. One such design is projected to avoid more than 125 million liters of water per facility each year compared with an evaporative system. That estimate applies only to the assumptions of the specific design. Hybrid facilities offer another option by operating dry during moderate weather and using limited evaporation during extreme heat.
The broader accounting remains important. Electricity associated with U.S. data centers carried an indirect water footprint of nearly 800 billion liters in 2023, while on-site systems differed sharply in how much water they withdrew or consumed. Eliminating routine evaporation at the facility can therefore reduce one part of the footprint without erasing the rest.
| Configuration | Heat Capture | On-Site Water Profile | Main Tradeoff |
|---|---|---|---|
| Room air cooling | Indirect | Depends on plant design | High air movement |
| Direct-to-chip with tower | At the processor | Evaporative consumption | Water use |
| Direct-to-chip with dry cooler | At the processor | Little routine use | Hot-weather electricity |
| Hybrid heat rejection | At the processor | Seasonal or limited | Control complexity |
| Heat-reuse system | Captured liquid heat | Design dependent | Nearby demand required |
Sources: ASHRAE, Microsoft, Berkeley Lab
What Design Does Not Solve Obsolescence Will
Competition will push modernization because operators compete on performance and cost. Yet markets will not automatically price every environmental consequence. Some burdens may remain outside the price of computation unless regulation or public opposition forces operators to account for them.
Lower water use per unit of compute can still accompany higher total use. Global data-center electricity consumption is projected to reach about 945 TWh by 2030, roughly twice its 2024 level, after annual growth near 15 percent. If computing demand expands faster than efficiency improves, aggregate resource use will rise despite better individual systems. Obsolescence will make weak designs harder to justify, but it will not eliminate every environmental impact.
| Facility Condition | Technical Position | Likely Path | Economic Trigger |
|---|---|---|---|
| Strong power and structure | Upgrade-capable | Modernize | Retrofit below replacement cost |
| Mixed infrastructure | Partial density support | Hybrid conversion | Selective AI demand |
| Limited power capacity | Poor frontier fit | Reassign | Lower-density workloads |
| High retrofit burden | Structurally constrained | Retire or replace | Upgrade exceeds asset value |
| Resource-constrained site | Locally unsustainable | Relocate workload | Permitting or operating risk |
Sources: Uptime Institute, ASHRAE, Berkeley Lab, U.S. Department of Energy
Environmental Scrutiny Must Follow the Technology
A credible review should begin with local conditions. It should examine the project’s water source and cooling method, along with the reliability of its electricity supply. It should also consider how the facility would perform during drought or extreme heat. The key question is whether the project delivers enough useful computing to justify its demands and whether the surrounding infrastructure can support it.
That standard moves the debate beyond the simple fact that data centers consume resources. A median text prompt using 0.24 watt-hours of energy and 0.26 milliliters of water says little by itself. Its meaning depends on the number of prompts, the size of the facility, and the systems used to cool and power it.
Public scrutiny can improve disclosure and project design. It can also force operators to address costs they might otherwise ignore. Oversight becomes less useful when it relies on outdated assumptions or treats every facility as equally harmful.
Blocking a modern project may not reduce demand. It may simply shift investment and environmental pressure to another region. That risk grows when limits on power or permitting make domestic development more difficult.
This matters because compute capacity is becoming a form of national productive capacity. Research and industry increasingly depend on it. Countries without enough domestic infrastructure may become reliant on foreign systems and outside technical priorities. Under continued growth in chip supply, AI data centers could require 10 GW of additional power capacity in 2025 and reach 68 GW globally by 2027.
The water debate is therefore also a debate about technological change. Better hardware and operating methods have reduced some risks, while cost and obsolescence are pushing weaker designs out of the market. Environmental safeguards must still protect finite resources, but they should address the infrastructure being built now rather than the infrastructure people remember. Nations that manage both demands will hold the stronger economic and geopolitical position.
| Review Dimension | Core Measure | Assessment Boundary |
|---|---|---|
| Water source | Potable, reclaimed, or other | Local supply system |
| Water balance | Withdrawal and consumption | Facility and watershed |
| Cooling system | Evaporative, dry, or hybrid | Operating design |
| Grid effect | Load and generation mix | Regional power system |
| Climate resilience | Drought and heat performance | Peak operating conditions |
| Compute efficiency | Useful work per resource | Workload and facility |
| Local capacity | Grid, watershed, community limits | Project scale |
Sources: ASHRAE, Berkeley Lab, RAND Corporation
TL;DR Summary
- U.S. data centers consumed 176 TWh in 2023, equal to about 4.4 percent of national electricity use.
- U.S. demand could reach 325–580 TWh by 2028, or approximately 6.7–12 percent of national consumption.
- Global data-center electricity use could reach 945 TWh by 2030 after annual growth near 15 percent.
- Electricity used by U.S. data centers carried an indirect water footprint of nearly 800 billion liters in 2023.
- The average electricity-related water intensity was approximately 4.52 liters per kilowatt-hour, with major regional variation.
- One measured median text prompt used 0.24 watt-hours of energy and 0.26 milliliters of water.
- Average rack density remained below 8 kW in 2024, while few facilities exceeded 30 kW in 2025.
- Specialized AI systems are moving beyond 100 kW per rack, with plans extending toward 300–400 kW.
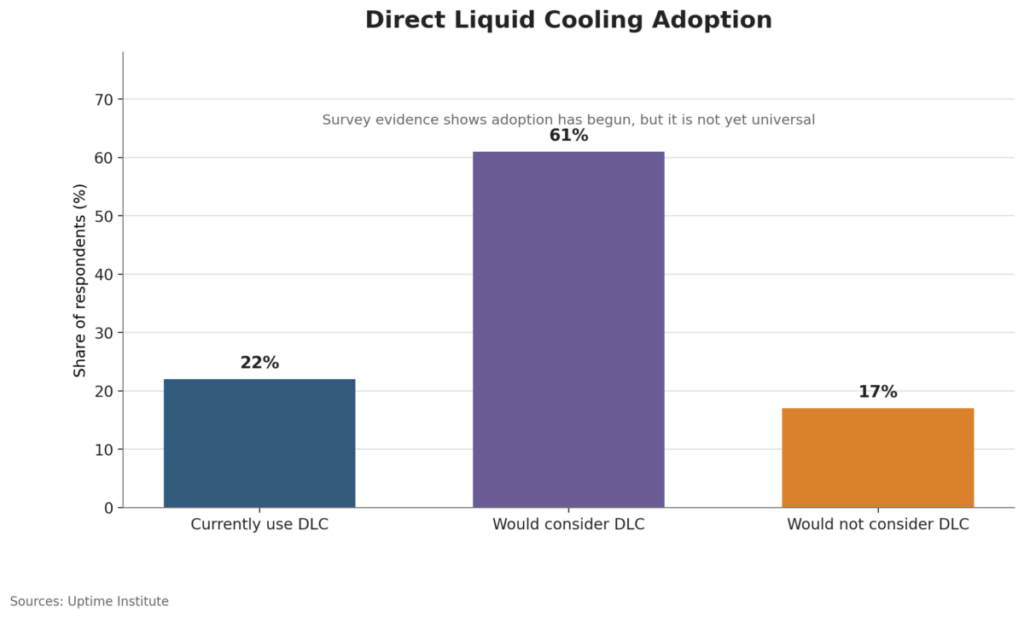
- A 2024 survey of 964 respondents found 22 percent using direct liquid cooling somewhere in their facilities.
- One chip-level cooling design is projected to avoid more than 125 million liters of cooling water annually per facility.
- U.S. data-center electricity use increased from 58 TWh in 2014 to 176 TWh in 2023.
- AI data centers could require 10 GW of additional capacity in 2025 and reach 68 GW globally by 2027.
Sources
- Lawrence Berkeley National Laboratory; 2024 United States Data Center Energy Usage Report; – Link
- International Energy Agency; Energy Demand from AI; – Link
- RAND Corporation; AI’s Power Requirements Under Exponential Growth; – Link
- U.S. Bureau of Industry and Security; Export Controls on Advanced Computing and Supercomputing Items; – Link
The Feared Data Center Belongs to an Earlier Era
- Lawrence Berkeley National Laboratory; The Water Use of Data Center Workloads; – Link
- Google; Measuring the Environmental Impact of Delivering AI at Google Scale; – Link
- Uptime Institute; Global Data Center Survey 2024; – Link
- npj Clean Water; Data Centre Water Consumption; – Link
Many of the Problems Have Already Been Reduced
- Google; Power Usage Effectiveness and Data-Center Efficiency; – Link
- Uptime Institute; Cooling Systems Survey 2024: Direct Liquid Cooling; – Link
- Uptime Institute; Global Data Center Survey 2025; – Link
- ASHRAE, NEMA and Pacific Northwest National Laboratory; Retrofit and Modernization Strategies; – Link
The Modern Data Center Is a Whole System Redesign
- ASHRAE, NEMA and Pacific Northwest National Laboratory; Energy and Thermal Efficiency; – Link
- ASHRAE, NEMA and Pacific Northwest National Laboratory; Integrated Design Principles; – Link
- Microsoft; Next-Generation Datacenters Consume Zero Water for Cooling; – Link
- Nature; Using Life-Cycle Assessment to Drive Innovation for Sustainable Cool Clouds; – Link
- Microsoft; 2026 Environmental Sustainability Report; – Link
What Design Does Not Solve Obsolescence Will
- U.S. Department of Energy; Powering AI and Data Center Infrastructure Recommendations; – Link
- RAND Corporation; Expanding U.S. Net Available Power Capacity by 2030; – Link
- U.S. Department of Energy and National Renewable Energy Laboratory; Best Practices Guide for Energy-Efficient Data Center Design; – Link
- Uptime Institute; Data Center Resource Use Will Raise Deep Questions and Opposition; – Link
Environmental Scrutiny Must Follow the Technology
- ASHRAE, NEMA and Pacific Northwest National Laboratory; AI Data Center Energy Performance Framework; – Link
- Uptime Institute; Water Is a Local Issue: Site Selection and Facility Design; – Link
- RAND Corporation; Evaluating Potential Artificial Intelligence Energy Capacity Development Sites; – Link
- Nature Reviews Clean Technology; Designing and Regulating Clean-Energy Data Centres; – Link
Keywords: Artificial Intelligence, Data Centers, Water Consumption, Liquid Cooling, Compute Economics, Environmental Externalities, Infrastructure Policy