
A mobile signal reaches the village, but the nearest government office remains three hours away. An entrepreneur opens the official portal on her phone to register a business and submits an identity number. The system fails to retrieve the record. Nothing is saved. No confirmation arrives. The following morning begins with a bus journey that the internet was supposed to eliminate.
She is connected, but she has not been served.
Across developing economies, network expansion has often outpaced the institutions operating behind it. Mobile coverage increasingly reaches rural populations, yet many schools, clinics, public agencies, and local businesses still lack the computing capacity and integrated records required to deliver dependable services across distance. The constraint no longer ends at the signal. It continues inside the institutions people are trying to reach.
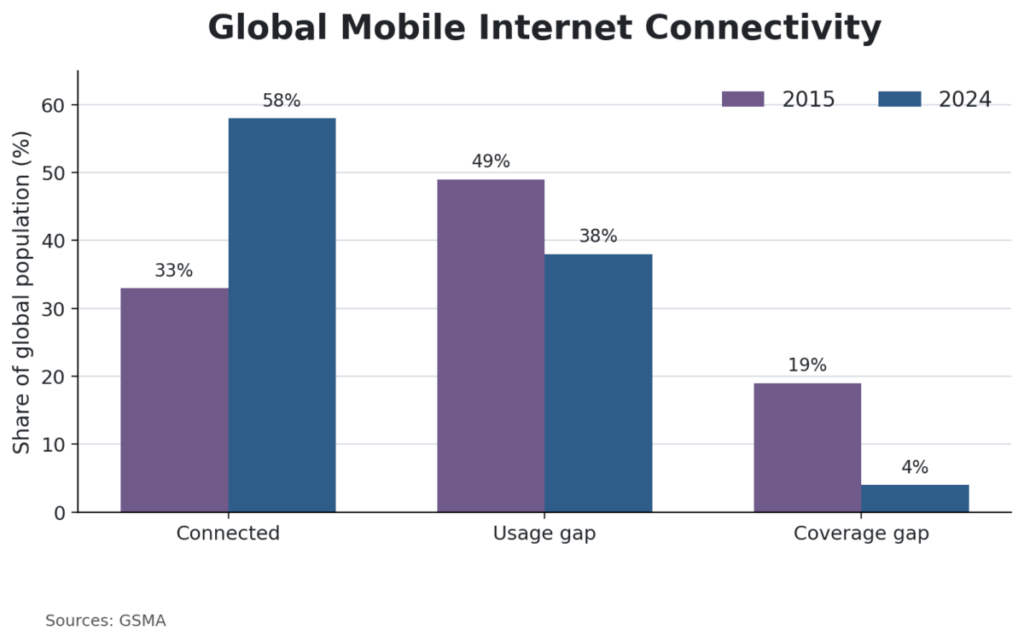
Although more than 90 percent of the global population lived within reach of mobile broadband in 2025, some 2.2 billion people remained offline. The mobile usage gap was larger still in earlier measurements: roughly 3.1 billion people lived within mobile internet coverage in 2023 without using it. Bangladesh exposed the same divide from another angle. Fourth-generation coverage reached the full population, while internet use remained near 53 percent.
The gap is especially pronounced in underserved markets. Sub-Saharan Africa has carried a mobile internet usage gap of about 60 percent, and women in low- and middle-income countries have remained less likely than men to use mobile internet. Coverage is therefore only one barrier. Adoption still depends on affordability and skills, while service quality determines how useful a connection becomes.
For connected users, network performance sets another practical boundary. Broadband in some rural areas has been nearly 50 percent slower than in cities, while users in the Maldives’ outer atolls received roughly half the speeds available in the capital. Within Lagos and Abidjan, mobile download speeds have varied by as much as 40 and 80 megabits per second. Those differences determine whether a person completes a video consultation or submits a form before the connection fails.
In underserved regions, internet access produces limited economic value when the institutions behind it cannot deliver reliable services. Infrastructure as a Service lowers part of the fixed cost of building that capability. Governments, hospitals, schools, and firms can extend their reach without constructing complete computing environments independently. The development return rests on whether rented resources become dependable transactions.
| Indicator | Evidence |
|---|---|
| Population within mobile broadband reach | More than 90% |
| People still offline, 2025 | About 2.2 billion |
| Covered but not using mobile internet, 2023 | About 3.1 billion |
| Bangladesh 4G coverage vs. internet use | 100% vs. about 53% |
| Sub-Saharan Africa mobile usage gap | About 60% |
Sources: World Bank, World Bank Data Partnership, GSMA
What Happens After the Screen Loads
From the user’s side, a digital service appears to begin and end with a button. Behind that action, the platform must establish identity and process the information required for a decision or transaction. The result must then return securely to the user. A failure anywhere in that chain reaches the user not as a technical defect, but as an incomplete institutional service.
Infrastructure as a Service allows an organization to rent the computing capacity required to perform those functions and maintain continuity when demand changes or equipment fails. Instead of financing and maintaining its own facilities, an institution expands or reduces resources as usage shifts. The provider operates the physical equipment, while the customer retains operational control and institutional responsibility.
Where capital and technical skills are scarce, that division carries particular value. Public agencies in developing economies often operate fragmented databases, while rural facilities contend with unreliable electricity and limited local support. Renting computing resources removes the need for every ministry, hospital, or school system to maintain a separate technical environment.
Uneven demand strengthens the economic case. A benefits portal faces a surge when a program opens. A payment service reaches its heaviest load near the end of the month. Purchasing hardware for peak demand commits scarce funds to equipment that remains underused for long periods, while on-demand computing shifts part of that burden from upfront investment to operating expenditure.
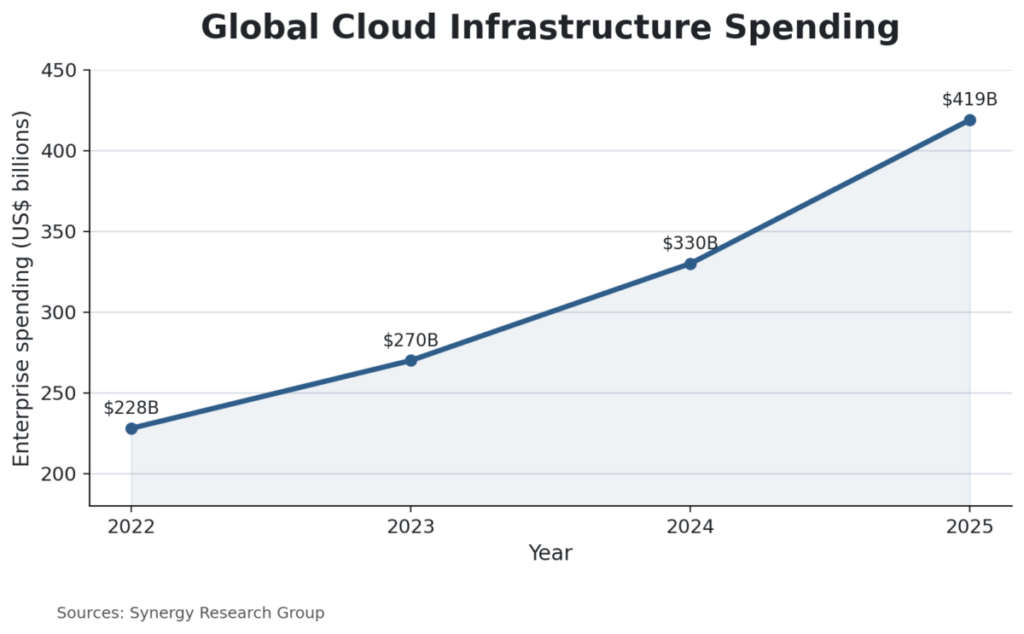
The wider cloud and data infrastructure market was valued at about $600 billion in 2022, with annual growth projected at roughly 20 percent through 2025. By 2025, enterprise cloud infrastructure spending alone had reached about $419 billion. Fourth-quarter spending approached $119 billion, with year-over-year growth near 30 percent. Yet fewer than 20 percent of low- and middle-income countries had modern data infrastructure capable of supporting large-scale cloud use and digital transformation.
The divergence carries an economic cost. Cloud capacity is expanding quickly at the global level, while many developing economies still lack the supporting infrastructure and institutional competence needed to access it efficiently. Dependence on distant cloud infrastructure raises latency and cost. It also exposes essential services to cross-border disruption. Networks may connect users to an address, but cloud-supported systems determine whether the institution can answer.
| Indicator | Figure |
|---|---|
| Cloud and data infrastructure market, 2022 | About $600 billion |
| Enterprise cloud infrastructure spending, 2025 | About $419 billion |
| Fourth-quarter 2025 spending | About $119 billion |
| Q4 year-over-year growth | About 30% |
| LMICs with modern data infrastructure | Fewer than 20% |
Sources: World Bank, Synergy Research Group
The Economics of Institutional Reach
For lower-income governments and smaller firms, IaaS changes when technology costs arise and who can afford them. Traditional infrastructure demands substantial spending before a service begins, tying scarce capital to physical equipment and specialist operating costs. Cloud services convert part of that fixed investment into expenditure that rises with use.
That shift lowers entry barriers for institutions unable to finance or justify their own computing facilities. A regional hospital can expand digital records without installing a server room. A local government can support online licensing without maintaining a separate technical environment for every department. Smaller firms gain access to cloud-hosted accounting or payment tools without carrying the same capital burden internally.
The economic gains associated with connectivity depend on precisely this kind of productive use. A 10 percent increase in broadband adoption has been associated with gross domestic product gains of up to 2 percent in low- and middle-income economies. Research covering nearly 50,000 firms across 117 developing and emerging markets has also linked wider internet adoption with stronger productivity and innovation.
Those gains do not come from the network alone. They emerge when firms use digital systems to lower transaction costs and improve coordination with customers, suppliers, and institutions. For a small enterprise, the benefit of cloud computing is not raw processing power. It is the ability to operate more reliably without building each supporting function internally.
Lower upfront costs create a different exposure. Weak procurement can produce overlapping contracts or uncontrolled storage charges, and proprietary tools can make switching expensive. An agency may save on hardware yet surrender bargaining power over migration and continuity.
Market concentration compounds that exposure. Three providers account for roughly 63 percent of global cloud infrastructure spending. Quarterly market spending rose from roughly $68 billion to $107 billion within eight quarters, reinforcing the scale advantages of the largest providers even as overall demand expanded. Developing economies gain access to world-scale computing while negotiating with suppliers whose pricing and technical standards remain largely beyond domestic control.
The strongest development case for IaaS lies not in reproducing the mature computing environments of the United States or Western Europe, but in extending institutional capability where capital is limited and service populations are geographically dispersed. In those settings, shared computing can compress years of infrastructure investment into a service contract, provided the surrounding technical and institutional environment can sustain it.
IaaS can lower the cost of entering the digital economy while raising the cost of leaving a provider.
| System | Operating Evidence |
|---|---|
| Rwanda Irembo | 30M+ requests; 600+ services |
| India digital public infrastructure | 1.4B+ people; billions of monthly payments |
| Tanzania interoperable payments | 450M+ transactions; 45 providers |
| Africa digital identity gap | 500M+ people |
| GovTech Maturity Index | 0.552 → 0.589, 2022–2025 |
Sources: World Bank, UNDP
From Available Services to Completed Services
The most credible measure of cloud-supported development is not the number of applications migrated or portals launched. It is the number of useful transactions completed with less time, lower cost, and less uncertainty.
By 2025, Rwanda’s Irembo platform had processed more than 30 million public-service requests and brought more than 600 government services into a common delivery environment. For rural residents, the benefit did not come from placing government information online. It came from reducing the need to travel repeatedly for paperwork and processing.
Much of that value comes from coordination. A business registration depends on identity, payment, and administrative records working as one process. Moving each form to a separate website digitizes the existing bureaucracy without reducing its fragmentation. A shared computing environment provides scale, but interoperability determines whether institutions complete the process as one service.
When systems cannot exchange information, users submit the same details repeatedly while agencies maintain duplicate records. Processing slows and errors multiply. Governments then continue operating digital and physical channels in parallel. Digitization becomes a more expensive administration rather than a more productive one.
At different scales, India and Tanzania demonstrate the value of coordination. India’s digital public infrastructure serves more than 1.4 billion people and supports payment volumes measured in billions of monthly transactions. Tanzania’s interoperable payment system has processed more than 450 million transactions while connecting 45 financial-service providers. In both cases, the economic gain comes from linking public and financial functions that would otherwise remain separate.
Institutional maturity remains uneven even as digital delivery expands. The World Bank’s GovTech Maturity Index rose from a global average of 0.552 in 2022 to 0.589 in 2025, showing measurable progress in public-sector digital capability while preserving substantial differences between countries.
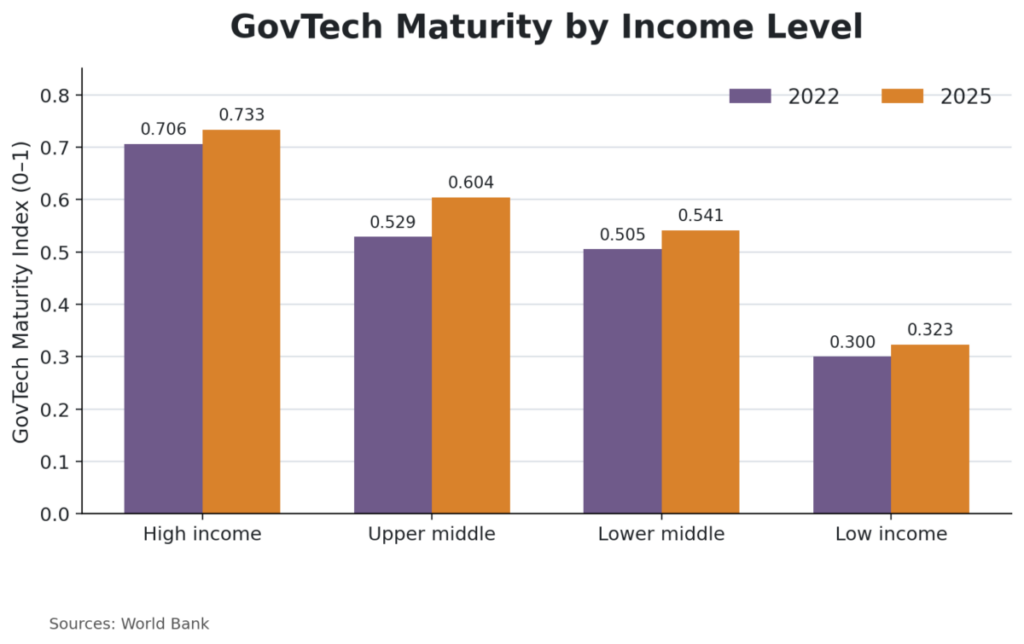
Scale alone does not produce inclusion. More than 500 million Africans lack verifiable digital identity. Internet use in low-income economies also remains sharply divided: around 30 percent of men use the internet, compared with fewer than 20 percent of women. Geography and income deepen the same access problem.
Once services move online, those disparities enter the transaction itself. A user without accepted documentation fails identity verification. Someone on a weak connection can lose an application before completion. A national platform can therefore increase aggregate use while excluding the same groups that already bear the highest cost of reaching physical institutions.
For the entrepreneur in the village, the relevant metric is not whether the portal received traffic. It is whether the registration was completed without another day lost to travel.
Performance should therefore be judged by whether users complete a service efficiently and whether the system remains resilient when conditions deteriorate. Inclusion determines whether those gains extend to underserved groups. Low-bandwidth design and assisted access are not secondary features; they shape whether scale translates into development.
| Reliability Indicator | Figure |
|---|---|
| Operators reporting an outage within three years | More than half |
| Significant outages costing over $100,000 | 54% |
| Significant outages costing over $1 million | About 1 in 6 |
| Serious outages considered preventable | About 4 in 5 |
| People without electricity in Sub-Saharan Africa, 2023 | 581 million |
Sources: Uptime Institute, World Bank
Scale Without Trust Is Fragile
As digital systems assume more essential functions, their failures carry greater consequences. An unavailable public or financial platform can interrupt income or delay care. For a household depending on benefits, a technical outage can also become an immediate welfare shock.
More than half of surveyed data-center operators had experienced an outage during the preceding three years. Fifty-four percent of significant outages cost more than $100,000, while roughly one in six exceeded $1 million. Around four in five serious outages were considered preventable through stronger management or system design. For institutions serving low-income populations, the losses extend beyond revenue because delayed service erodes public confidence as well.
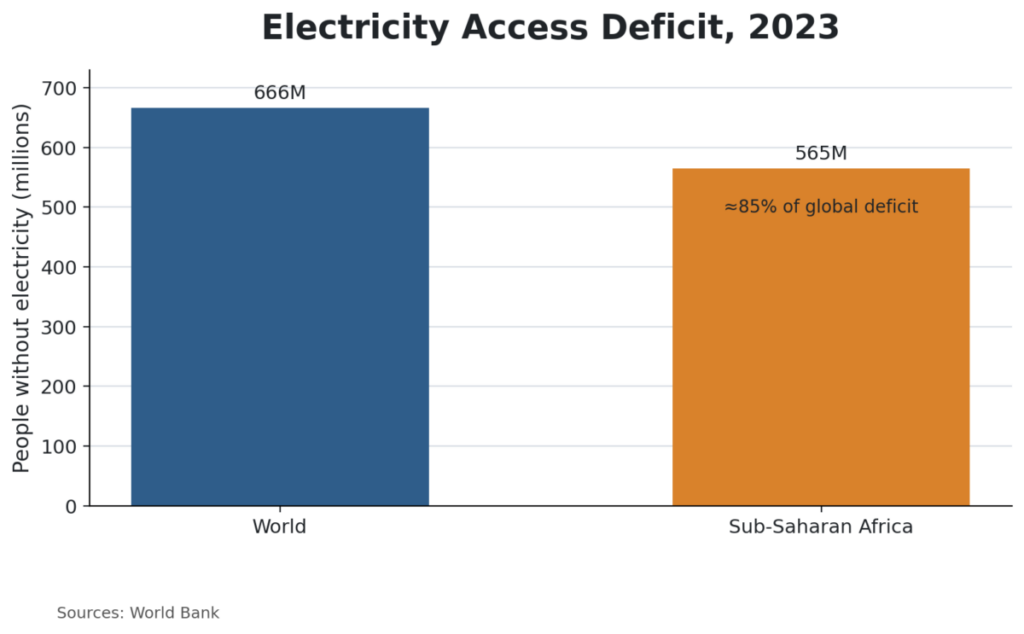
Power reliability belongs to the same equation. Of the 666 million people without electricity in 2023, 581 million lived in Sub-Saharan Africa. A country cannot separate cloud strategy from energy strategy when public services and commercial systems rely on both.
Although shared facilities can use computing equipment more efficiently than numerous underused server rooms, cloud services remain physical. Data centers depend on power and connectivity, backed by technical operations capable of keeping those systems running. Their location shapes cost and resilience while influencing both service speed and environmental pressure.
Trust creates an equally important constraint. Users must believe records are accurate and personal information is protected. They also need a way to correct errors. When a system rejects an identity or loses an application, the damage extends beyond one transaction because confidence in other digital services weakens with it.
Cloud adoption does not transfer institutional responsibility to the provider. Governments and firms still need sound operational governance, continuity planning, and clear accountability for data use. The provider operates the equipment, but the institution remains responsible for the service.
Effective policy turns on control, continuity, and inclusion. Control depends on whether institutions can audit systems and move their data when necessary. Continuity requires tested recovery arrangements when a provider or connection fails. Inclusion depends on service design that still works for users with weak connections or limited documentation.
Sovereignty is not achieved merely by placing a server inside a national border. It depends on whether institutions can govern and protect the systems on which public life relies, while retaining the ability to move away from them when necessary.
| Reliability Indicator | Figure |
|---|---|
| Operators reporting an outage within three years | More than half |
| Significant outages costing over $100,000 | 54% |
| Significant outages costing over $1 million | About 1 in 6 |
| Serious outages considered preventable | About 4 in 5 |
| People without electricity in Sub-Saharan Africa, 2023 | 581 million |
Sources: Uptime Institute, World Bank
Measure What People Can Complete
The entrepreneur at the government portal should not be counted as successfully served because the page loaded. Progress occurs when the identity record is retrieved and the registration is issued without an unnecessary journey.
Spending, data-center construction, and migration announcements describe capacity, but they do not establish that a service is reliable or economically useful. The rise in the GovTech Maturity Index from 0.552 in 2022 to 0.589 in 2025 shows that institutional capability can be tracked over time. Aggregate improvement, however, still says little about whether individual users complete the services they need.
Measures closer to human performance provide a stronger test. Completion shows whether users reach the end of a process. Efficiency reveals whether scale lowers the cost of providing that service. Resilience shows whether the system continues to function when infrastructure fails, while inclusion establishes who actually benefits.
Investment should follow the same logic. Cloud resources produce stronger returns when reliable infrastructure is matched by interoperable public systems and institutional capability. Without those complementary foundations, countries acquire advanced computing while preserving the weaknesses that prevent people from using it.
For developing economies and underserved rural regions, IaaS is valuable because it allows institutions with limited capital and broad geographic responsibilities to deliver services that would otherwise remain costly or physically distant. Fragmentation does not disappear automatically, but the cost of overcoming it can fall sharply when computing capacity no longer has to be built institution by institution.
The next digital divide will not separate only those who are online from those who are offline. It will separate underserved populations whose connections lead to functioning institutions from those whose connections still end at the screen.
| Infrastructure Metric | Development Metric |
|---|---|
| Network coverage | Service completion rate |
| Portal visits | Completed transactions |
| Cloud capacity | Cost per completed service |
| System uptime | Recovery after failure |
| Registered users | Underserved users completing services |
Sources: World Bank, UNDP
TL;DR Summary
- Connectivity creates limited development value when institutions cannot complete services behind it.
- More than 90 percent of the global population lives within mobile broadband coverage, yet billions remain offline or within the usage gap.
- IaaS reduces the fixed cost of computing for undercapitalized governments and firms.
- Global cloud spending is expanding rapidly while modern data infrastructure remains scarce across many low- and middle-income countries.
- Productive gains arise when cloud-supported systems lower transaction and coordination costs.
- Interoperability determines whether digitization reduces or reproduces administrative fragmentation.
- Rwanda, India, and Tanzania show how shared digital systems can operate at population scale.
- Market concentration creates pricing, portability, and bargaining risks.
- Scale does not guarantee inclusion where identity, affordability, literacy, or power remain weak.
- Reliability failures impose financial costs and interrupt essential services.
- Energy planning and cloud strategy are inseparable in electricity-constrained economies.
- Development performance should be measured through completion, cost, resilience, and inclusion.
Sources
The Service Behind the Connection
- World Bank; The Unfinished Digital Revolution: Expanding Internet Access; – Link
- World Bank Data Partnership; Understanding Internet Connectivity to Tackle the Digital Divide; – Link
- GSMA; The State of Mobile Internet Connectivity 2025; – Link
What Happens After the Screen Loads
- World Bank and International Finance Corporation; Advancing Cloud and Data Infrastructure Markets: Strategic Directions for Low- and Middle-Income Countries; – Link
- World Bank; Cloud Computing Q&A; – Link
- Synergy Research Group; GenAI Helps Drive Quarterly Cloud Revenues to $119 Billion as Growth Rate Jumped Yet Again in Q4; – Link
The Economics of Institutional Reach
- Annual Review of Economics; The Economic Impact of Internet Connectivity in Developing Countries; – Link
- The World Bank Economic Review; Overcoming Obstacles: The Internet’s Contribution to Firm Development; – Link
- VoxDev; How Does Internet Connectivity Impact Developing Economies?; – Link
From Available Services to Completed Services
- United Nations Development Programme; Digital Public Infrastructure in Africa: A Leapfrog Catalyst for Inclusive Growth; – Link
- World Bank; Global Digital Public Infrastructure Program: From Foundations to Scale; – Link
- World Bank Project FASTT; Tanzania Instant Payment System TIPS; – Link
Scale Without Trust Is Fragile
- Uptime Institute; Annual Outage Analysis 2025; – Link
- World Bank; Access to Electricity: Who Remains Without Power?; – Link
Measure What People Can Complete
- World Bank; 2025 GovTech Maturity Index Update; – Link
- OECD; Digital Government Outlook 2026; – Link
Keywords: Cloud Computing, Digital Access, Rural Development, Digital Public Infrastructure, Institutional Capacity, Service Interoperability, Development Economics